
MonoCoinSignal
@t_MonoCoinSignal

تریدر چه نمادی را توصیه به خرید کرده؟
سابقه خرید
تخمین بازدهی ماه به ماه تریدر
پیام های تریدر
فیلتر
نوع پیام
MonoCoinSignal
Bearish Trap or Real Breakdown?
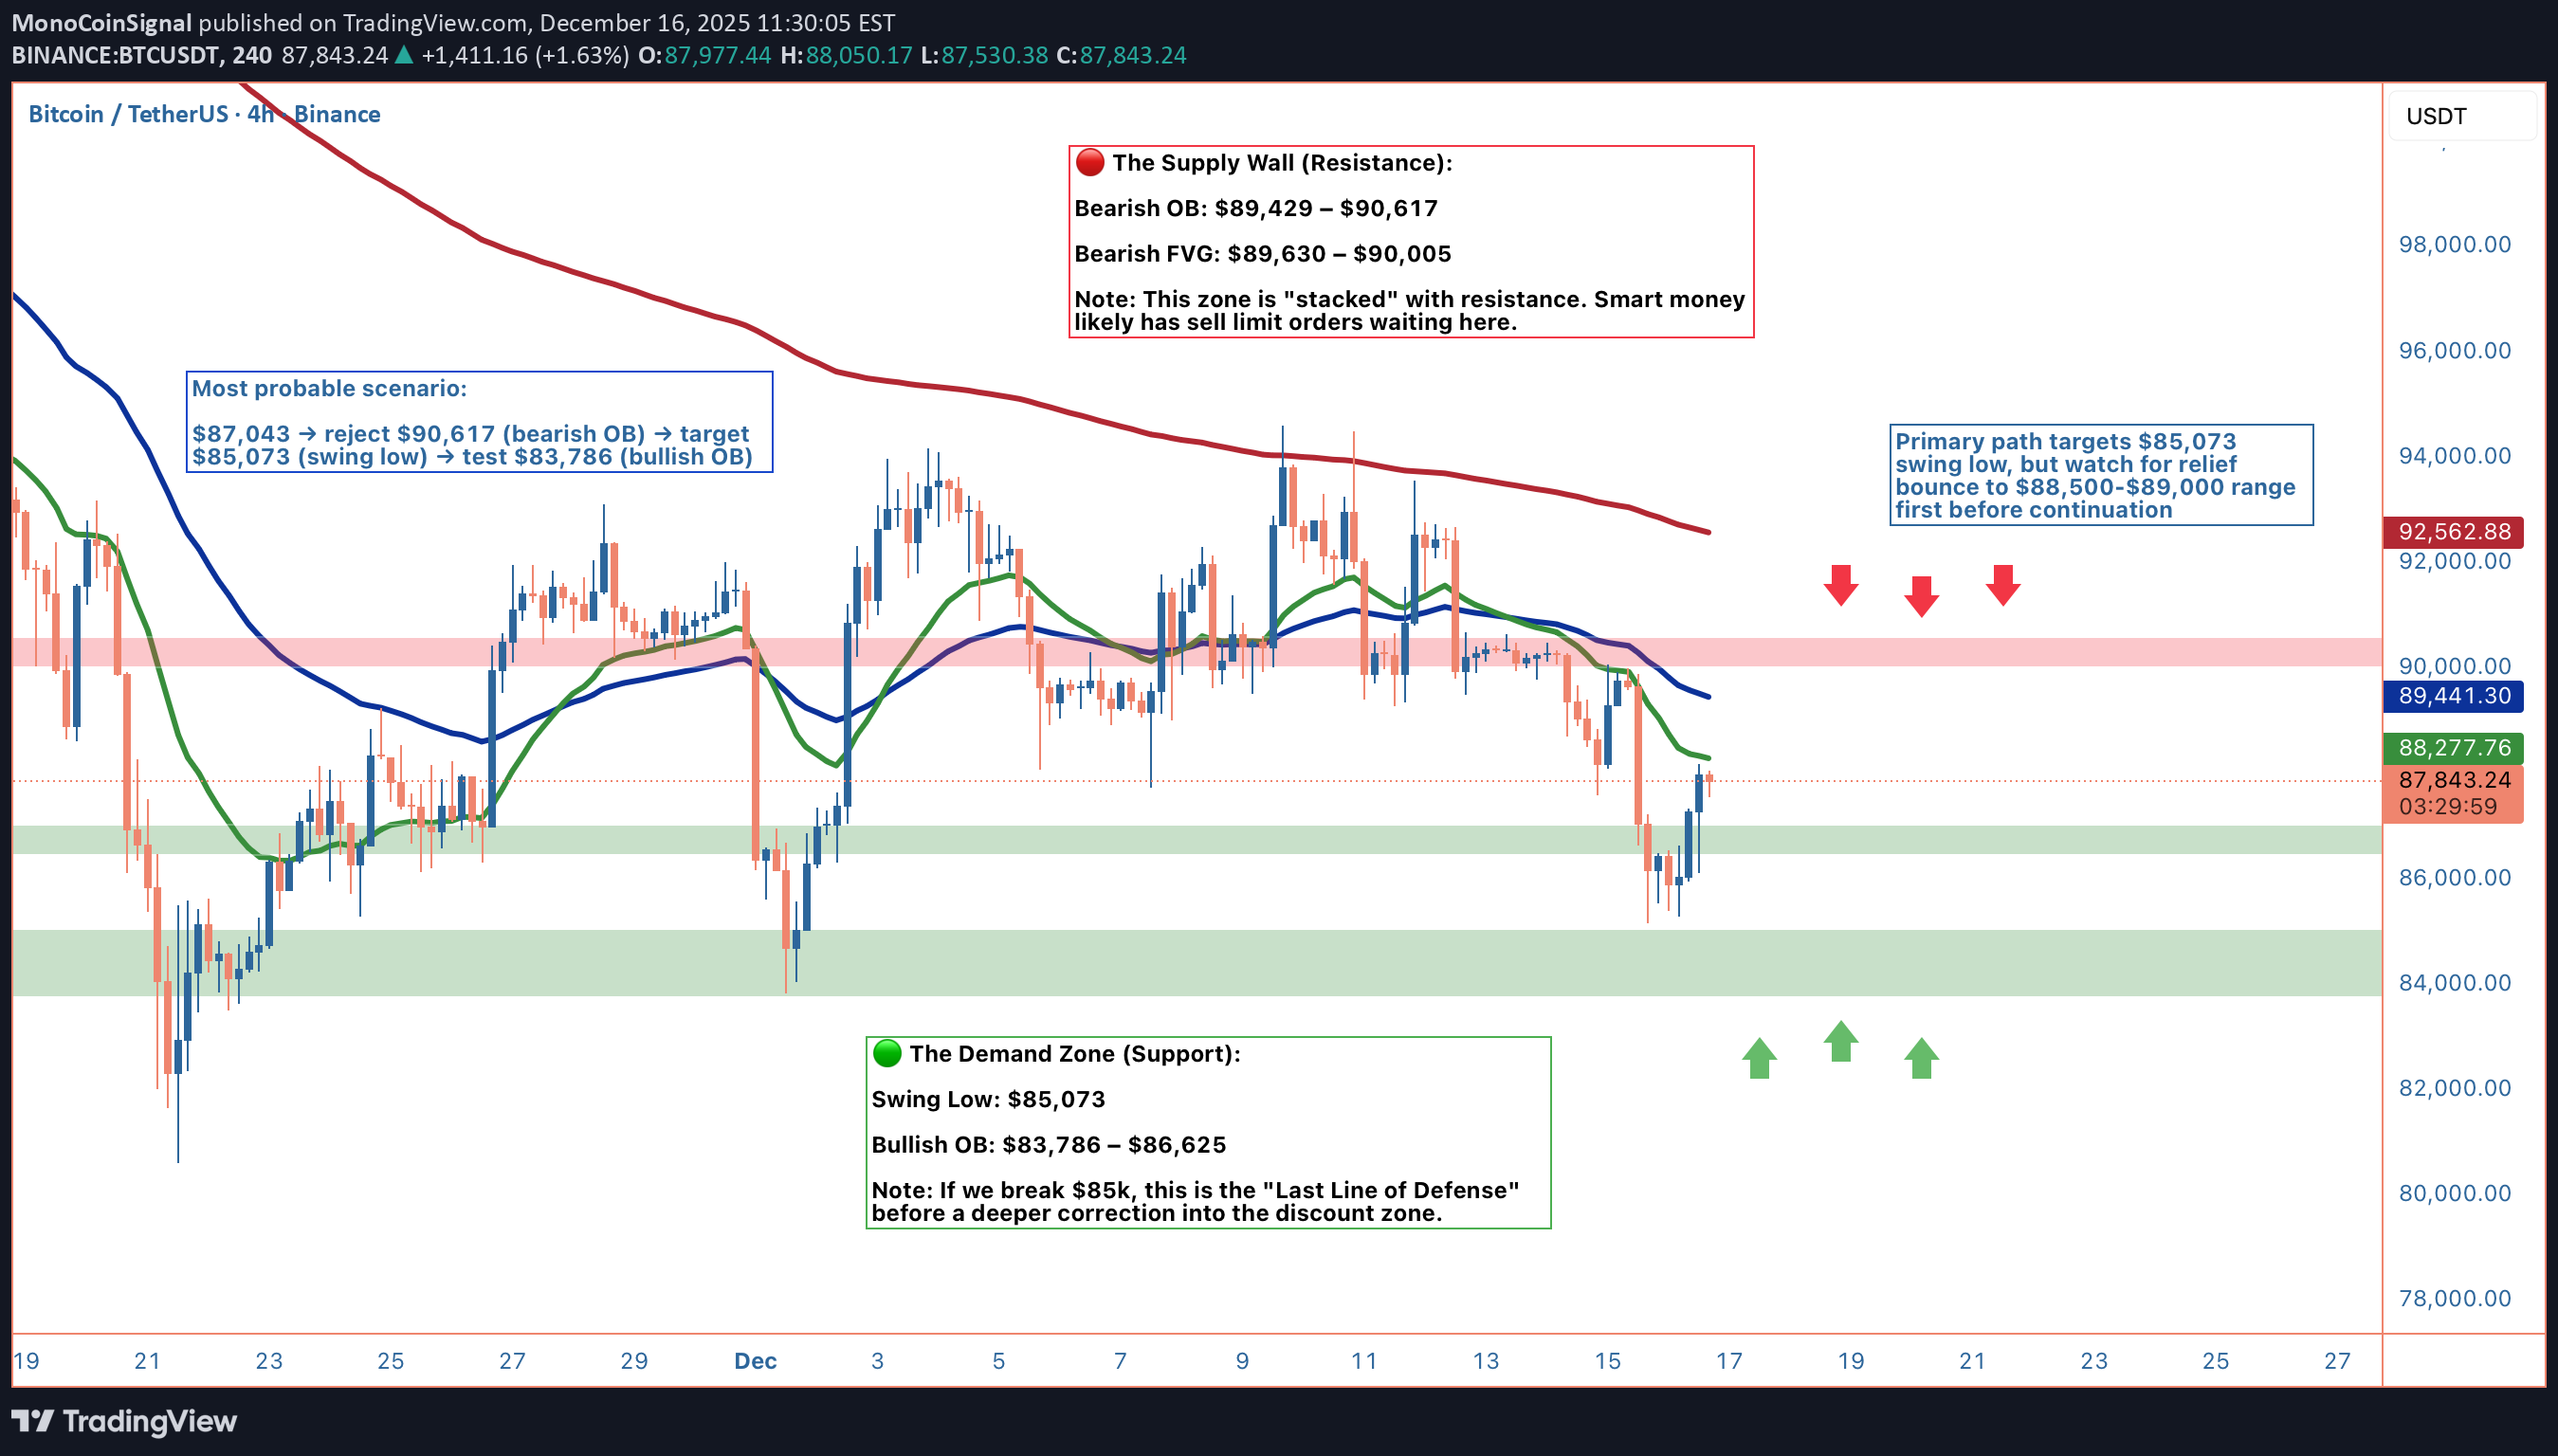
در حال حاضر، ما روی 87158 دلار نشسته ایم که ما را در میانه تعادل بین نوسان اوج اخیر در 94555 دلار و نوسان پایین در 85073 دلار قرار می دهد. این فقط یک نقطه تصادفی در نمودار نیست. این یک نقطه تصمیم گیری حیاتی است که در آن ساختار بازار سرنخ های مشخصی به ما می دهد. پیشرفت بزرگ در اینجا CHoCH Bearish است که به تازگی تایید شده است. برای کسانی که مفاهیم پول هوشمند را ردیابی می کنند، این یک تغییر شخصیت به سمت نزولی است، به این معنی که ما دنباله پایین ترها را شکسته ایم. ساختار صعودی که برای هفته ها ادامه داشت تغییر کرده است و ما باید کتاب بازی خود را مطابق با آن تنظیم کنیم. بیایید از تلاقی فنی صحبت کنیم، زیرا وقتی شاخص ها را layer می کنید، story بسیار خاص می شود. قیمت در زیر هر سه major EMA (20، 50 و 200) معامله می شود، که یک تراز نزولی در سراسر صفحه ایجاد می کند. هنگامی که به این شکل زیر میانگین متحرک خود هستید، مسیر کمترین مقاومت معمولاً پایین است. MACD این را با یک قرائت عمیق نزولی از -1087 تأیید می کند و شکاف بین خطوط سیگنال در حال افزایش است - تکانه با اطمینان به سمت جنوب می رود. با این حال، اینجاست که راه اندازی مشکل می شود و چرا باید به دو حرکت جلوتر فکر کنید. RSI در حوالی 34 معلق است و به قلمرو فروش بیش از حد نزدیک می شود و آخرین شمع با فتیله عظیم 64.5 درصد پایین تر چاپ شده است. این به ما می گوید که شخصی برای خرید "ارزش منصفانه" با اندازه وارد عمل شده است. ما کاملاً در سطح وحشت نیستیم، اما به اندازه کافی نزدیک هستیم که یک جهش امدادی کاملاً روی میز باشد. این یک تنش در بازار ایجاد می کند: ساختار می گوید "فروش"، اما حرکت فوری می گوید "جهش". نقطه تساوی در اینجا ADX است که روی 62.7 قرار دارد. این نشان دهنده یک محیط پرطرفدار قدرتمند است. این اقدام قیمتی متلاطم و بدون جهت نیست. زمانی که ADX بالای 60 باشد، روندها همچنان ادامه دارند. بنابراین، در حالی که RSI در مورد جهش هشدار می دهد، ADX می گوید بدون تأیید واضح با روند مبارزه نکنید. بنابراین، در اینجا نقشه راه است. سناریوی اولیه به نفع رد در مقاومت است. هرگونه جهش امدادی از اینجا احتمالا مستقیماً به بلوک سفارش نزولی (منطقه عرضه) بین 89429 تا 90617 دلار میرسد. این ناحیه با تلاقی انباشته شده است: شامل سفارشات فروش پر نشده، یک FVG نزولی است و درست زیر ناحیه حق بیمه threshold قرار دارد. اگر شاهد افزایش قیمت در منطقه 89 تا 90 هزار دلار باشیم، به یک فرصت کوتاه با احتمال بالا تبدیل میشود. ما در آنجا به دنبال سیگنالهای رد هستیم تا نوسان پایین را در 85073 دلار هدف قرار دهیم. این سطح را بشکنید و ما به منطقه تقاضای بلوک سفارش صعودی بین 83786 تا 86625 دلار نگاه می کنیم، جایی که من انتظار دارم در نهایت علاقه خرید جدی ظاهر شود. اگر به دنبال تجارت هستید، صبر در اینجا مزیت شماست. کاهش قیمت 87 هزار دلاری با RSI بیش از حد، ریسکی است. بازی تنظیم شده با ریسک بهتر در انتظار جهش به محدوده 88500 تا 90000 دلار است. سطح ابطال شما (توقف ضرر) یک بسته 4 ساعته بالاتر از 90617 دلار است. اگر قیمت بالاتر از آن سطح بسته شود، بلوک سفارش نزولی را نفی می کند و تز عرضه را باطل می کند. از طرف دیگر، اگر گاوها موفق به بازپس گیری 91,066 دلار شوند (منطقه برتر threshold)، باعث بازگشت CHoCH صعودی می شود. این امر کل ساختار را به نفع گاوها برگرداند و 94185 دلار را هدف قرار داد. اما در حال حاضر، با اجرای ولوم 2 برابر متوسط و بایاس داخلی در حالت خنثی/نزولی، این مسیر احتمال کمتری است. خط پایین: ساختار به دنبال ادامه مسیر نزولی است، اما فقط پس از یک جهش بالقوه تسکین. ما یک تغییر روند تایید شده، پشته های EMA نزولی و حجم قوی در کاهش داریم. در کوتاه کردن انتهای محدوده به دام نیفتید و در آرزوی پرش "مرده cat" به دام نیفتید. منتظر تست عرضه در 90 هزار دلار باشید، منتظر رد شدن باشید و مسیر کمترین مقاومت را معامله کنید. در ادامه روند نزولی به دلیل آسیب ساختاری، اطمینان تقریباً در 75 درصد قرار دارد، اما شرایط فروش بیش از حد ما را ایجاب میکند که منتظر قیمتهای ورودی بهتر باشیم.
MonoCoinSignal
Bulls Flexing Strength
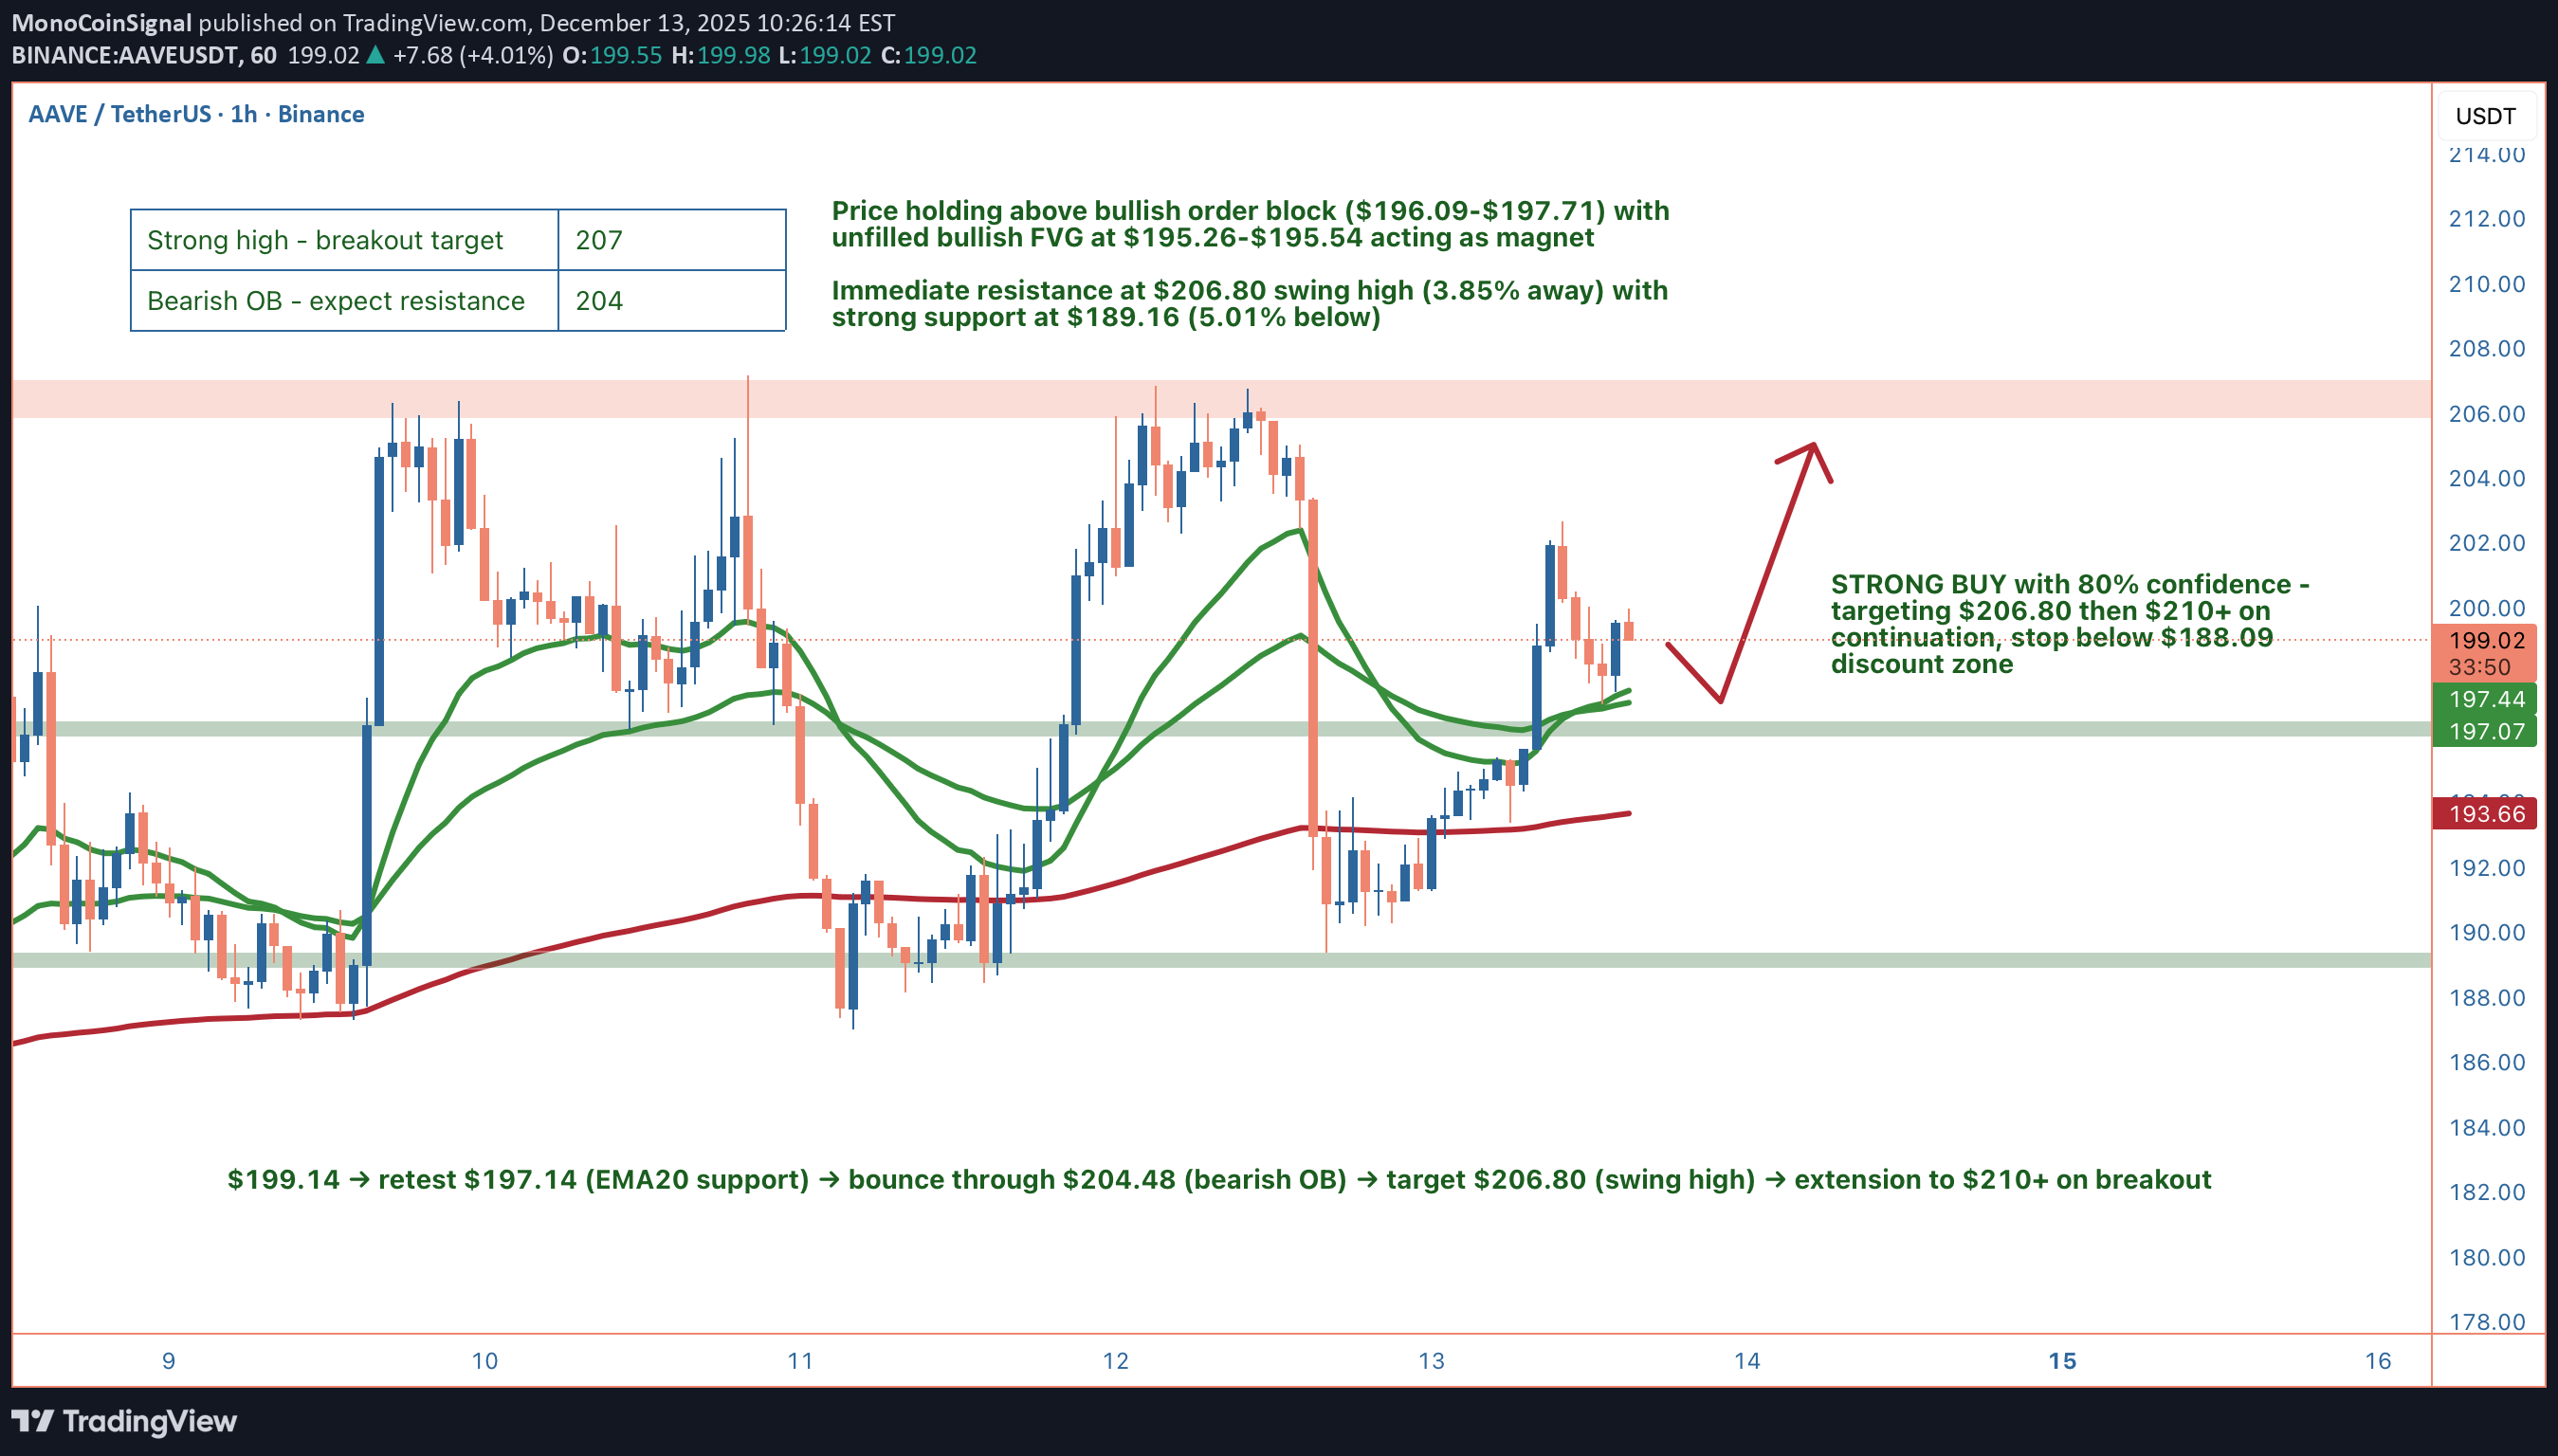
Hey guys, AAVE is setting up one of those textbook bullish continuation patterns that makes you sit up and pay attention. The current price of $199.14 sits right in the equilibrium zone, perfectly balanced between premium and discount levels. What's immediately striking is the clean higher low formation that's been confirmed, with price holding firmly above all major moving averages. The EMA20 at $197.14, EMA50 at $196.87, and EMA200 at $193.39 are all stacked bullishly beneath current price, creating a support ladder that's characteristic of strong uptrends. This alignment doesn't happen by accident - it's the result of sustained buying pressure and institutional accumulation. The ADX reading of 53.3 is absolutely critical to understanding the current market state. This indicator measures trend strength, and anything above 25 signals a trending market rather than choppy consolidation. At 53.3, we're looking at a strong, established trend that has momentum behind it. When you pair this with the MACD showing powerful bullish divergence (0.6012 vs 0.0205 signal line), the technical picture becomes crystal clear. The MACD histogram is expanding positively, indicating accelerating bullish momentum rather than a weakening trend. The RSI at 68.7 is approaching overbought territory but hasn't reached extreme levels yet. This is actually ideal for continuation setups - we want to see strength, not weakness. The RSI has room to push into the 70-80 zone during strong trending moves, so this reading suggests we're in the middle of a move rather than at an exhausted top. The MFI at 66.8 confirms that money flow is supporting this price action, with capital flowing into AAVE rather than exiting. From a Smart Money Concepts perspective, this setup gets even more interesting. Price is currently trading above a bullish order block that spans $196.09 to $197.71. This zone represents an area where institutions likely accumulated positions during the previous move up, and it's now acting as a demand zone. Order blocks are one of the most reliable SMC concepts because they mark areas where smart money has shown their hand. The fact that we're holding above this level suggests institutional support remains intact. There's also an unfilled bullish Fair Value Gap sitting at $195.26-$195.54. FVGs represent inefficiencies in price action where the market moved too quickly, leaving behind an imbalance. These gaps act as magnets - if we see any pullback, this $195.26-$195.54 zone would be an ideal area for smart money to add to positions. It's essentially a discount entry point within the broader uptrend. The bearish order block at $204.48-$199.70 represents the immediate supply zone we need to reclaim. This is where sellers previously showed strength, and reclaiming this zone with volume would be a significant bullish signal. A break above $204.48 with expanding volume would likely trigger stops and fuel a move toward the swing high at $206.80. The market structure is showing higher lows, which is the definition of an uptrend. The recent swing low at $189.16 held firm, and the even stronger low at $186.85 provides an additional backstop. The Bollinger Bands show price trading above the middle band at $195.32, with the upper band at $202.02 within striking distance. When price walks the upper Bollinger Band in a strong trend, it often signals continuation rather than reversal. Volume analysis reveals current levels at $19,995 versus an average of $22,867. While this is slightly below average, it's not concerning given we're in a consolidation phase. What we want to see is volume expansion as price approaches the $204.48 resistance zone. A breakout on declining volume would be suspect, but a breakout with volume above $25,000+ would confirm institutional participation. The 24h volume of $161 million shows healthy overall interest in AAVE. The wick analysis is particularly revealing. The lower wick represents 24.9% of the candle range, while the upper wick is only 11%. This asymmetry tells a story - buyers are aggressively defending lower prices (creating large lower wicks), while sellers aren't showing the same aggression at higher prices (small upper wicks). This imbalance in supply and demand dynamics typically precedes upside moves. For a complete trading setup, here's how I'd approach this: Entry zone is $197-199, with aggressive traders potentially entering at current levels given the strong technical backdrop. More conservative traders might wait for a pullback to the $195.26-$195.54 bullish FVG for a better risk-reward entry. The stop loss should be placed below $188.00 - a 4H close beneath the discount zone at $188.09 would invalidate the bullish market structure and break the higher low formation. This isn't just a random percentage-based stop; it's a structural level where the thesis breaks. Target the swing high at $206.80 for TP1, which represents a 3.85% move from current levels. If we get a clean breakout above $206.80 with volume confirmation, look for extension targets at $210 and potentially $215 based on measured moves. The risk-reward on this setup is approximately 1:2.5 from current levels, which is solid for a continuation play. If entering from the FVG around $195, the R:R improves to nearly 1:4. The confidence level on this setup is 78% - high conviction but not maximum. What keeps this from being a 90%+ setup is the slightly below-average volume and the fact that we're in equilibrium rather than deep discount. The ideal scenario would be a quick wick down to $195 on a volume spike (liquidity grab), followed by immediate reclaim and push through $204.48. That would be the textbook smart money playbook. Alternative scenarios to consider: if price rejects hard at the $204.48 bearish order block without volume confirmation, we could see a deeper pullback to the $195.26 FVG or even the $189.16 swing low. This wouldn't invalidate the bullish thesis unless we close below $188.00. Consolidation between $197-204 for another 12-24 hours would actually be healthy, allowing the RSI to cool off slightly before the next leg up. What are you thinking here? Are you waiting for a pullback to the FVG for a better entry, or taking the trade at current levels given the strong momentum?
MonoCoinSignal
Choppy Waters Ahead
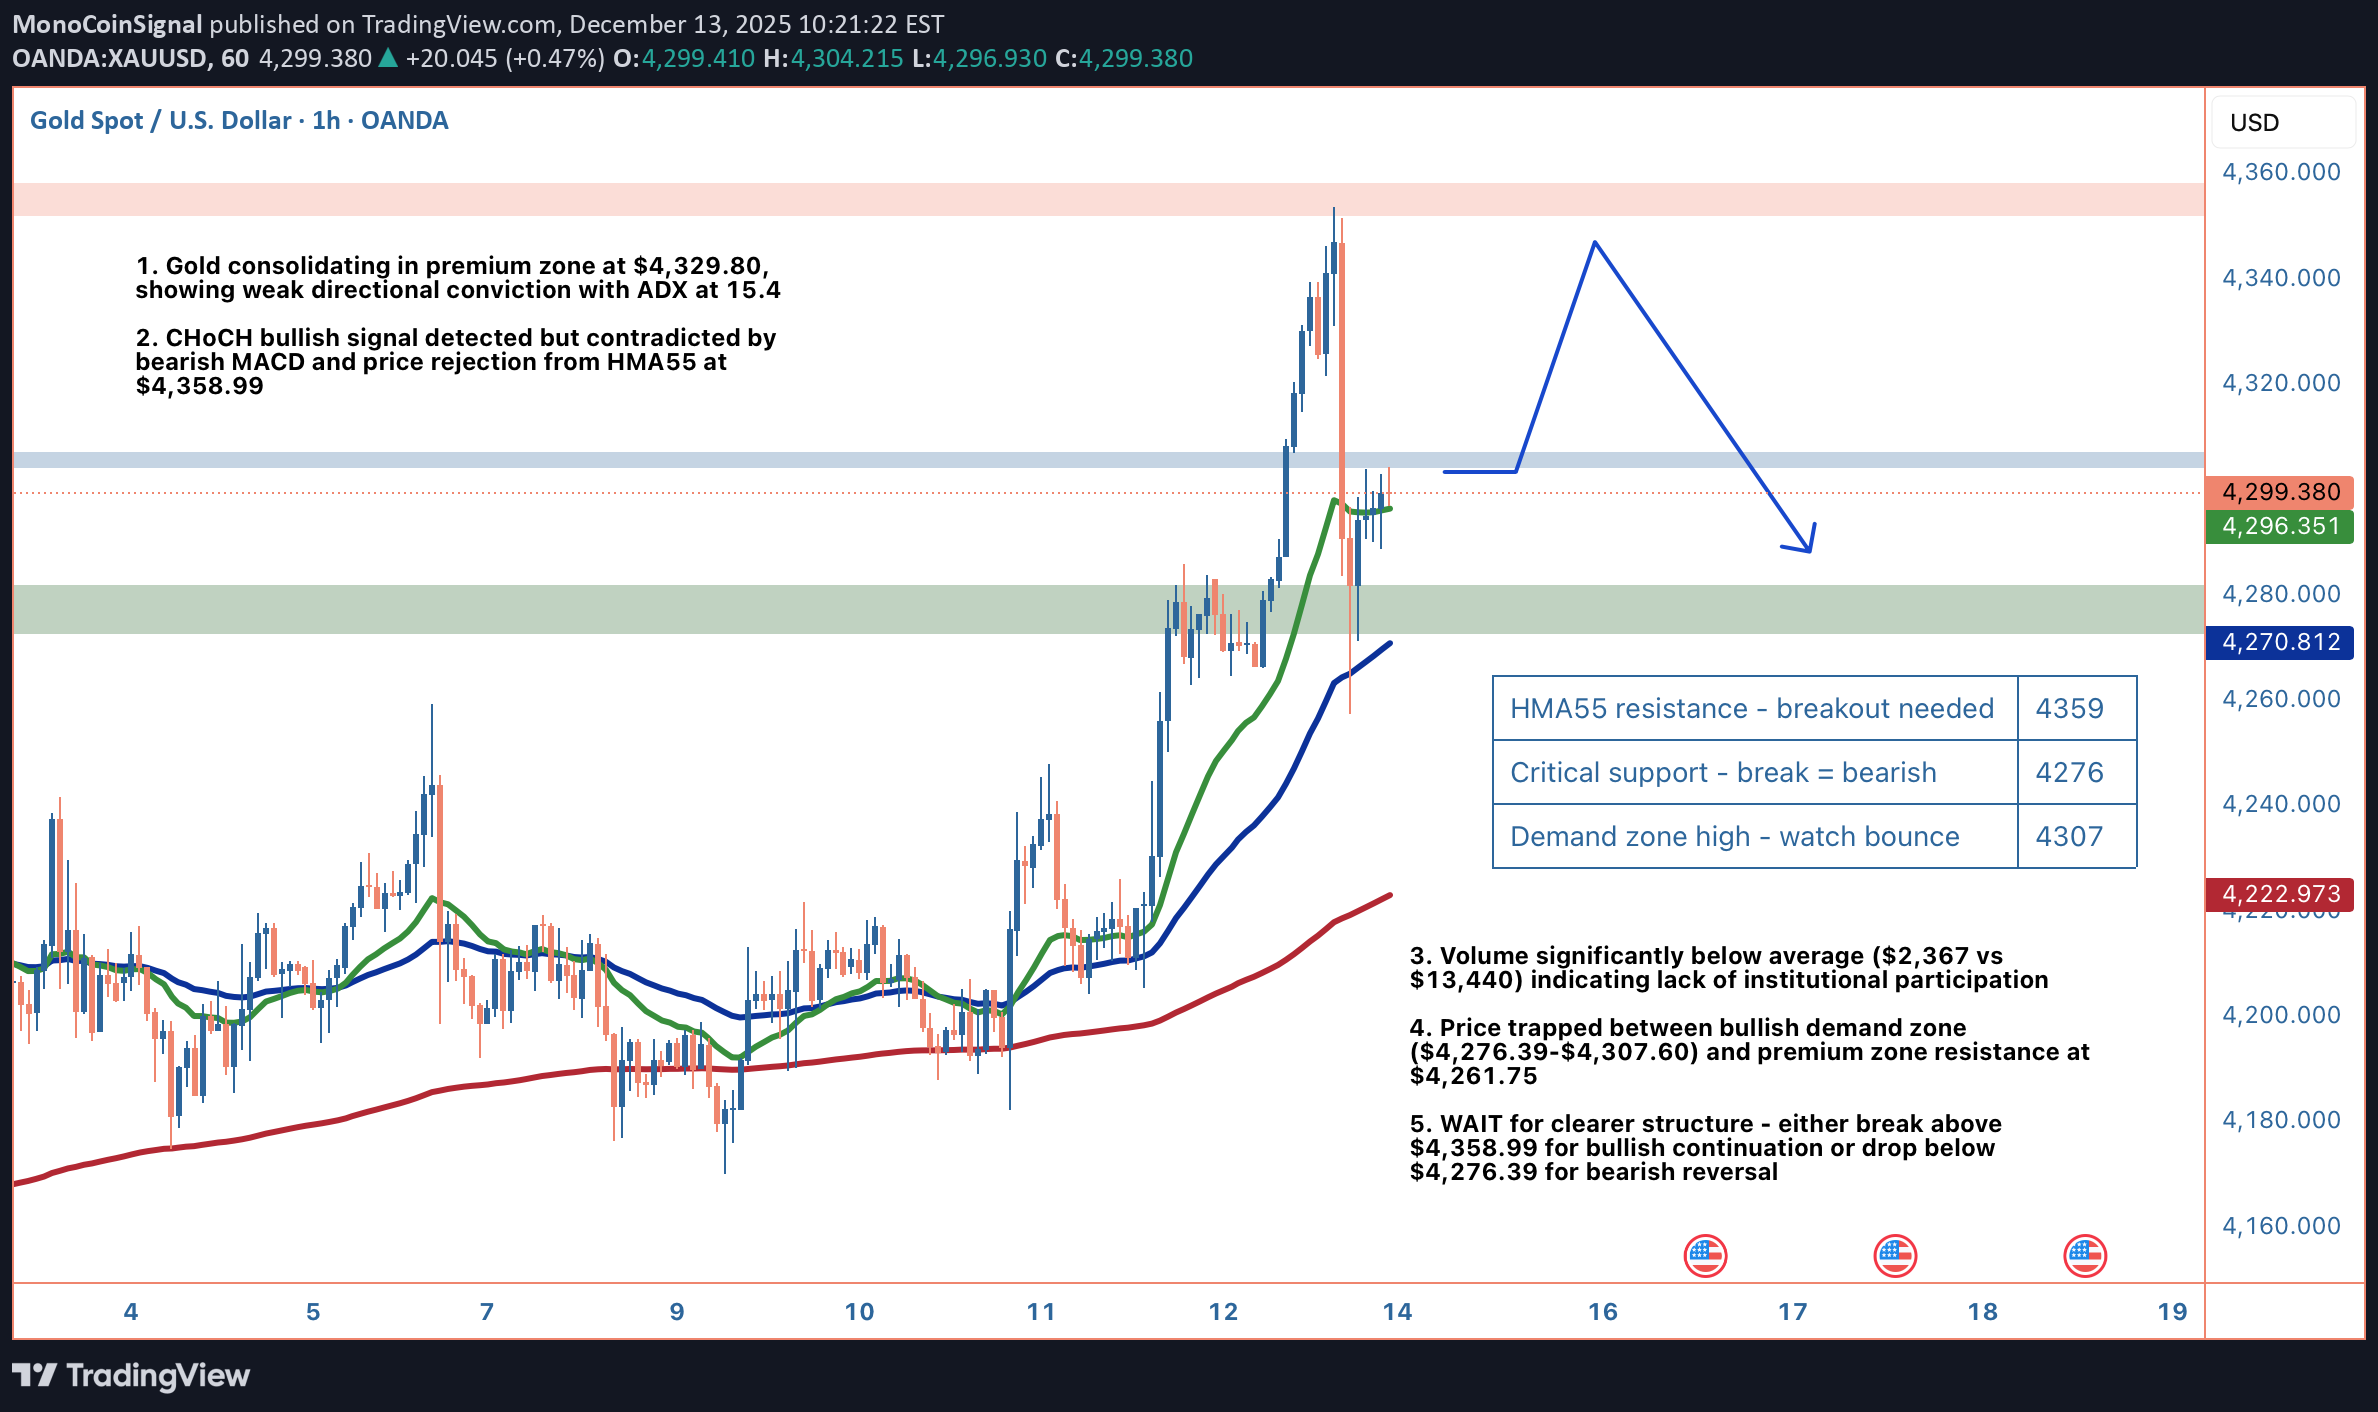
Hey traders, hope your charts are treating you better than this choppy gold action! Gold is serving up a classic case of market indecision at $4,329.80, and honestly, this is one of those moments where patience beats forcing a trade. We're sitting in premium territory, which typically favors sellers, but the price action is so lackluster that neither bulls nor bears have control. The ADX at 15.4 confirms what your eyes are probably telling you: this trend has zero strength right now. Let's break down what's actually happening here. Price is hovering just above the EMA20 at $4,328.00 and well above the EMA50 at $4,301.44, which would normally signal bullish momentum. But here's the kicker: we're still below the EMA200 at $4,329.79, creating this awkward middle ground where neither side can claim victory. The RSI at 53.5 is perfectly neutral, and the Stochastic at 54.6 mirrors that same indecision. Even the MACD is showing bearish divergence with the histogram trending down, yet it's not strong enough to trigger real selling pressure. The volume situation is what really concerns me. Current volume sits at $2,367 compared to an average of $13,440. That's an 82% drop, folks. When institutional money isn't participating, any moves we see are likely retail-driven and prone to quick reversals. This explains why we've been range-bound between $4,302.70 and $4,335.00 for the past 24 hours with virtually no net change. From a Smart Money Concepts lens, we've got some interesting dynamics at play. There's a bullish order block (demand zone) sitting between $4,276.39 and $4,307.60 that's been respected so far. This represents an area where smart money previously accumulated positions, and it's acting as a floor. Above us, the HMA55 at $4,358.99 is providing dynamic resistance, and price got rejected from this level recently. The bearish fair value gap from $4,326.50 to $4,339.29 has already been filled, so that imbalance is off the table. The market structure shows a CHoCH bullish signal, suggesting a potential trend reversal to the upside. However, I'm skeptical of this signal given the weak volume and conflicting indicators. For this bullish reversal to have legs, we'd need to see a decisive break above $4,358.99 with a surge in volume. That would open the door to the Bollinger upper band at $4,385.62 and potentially the recent swing high at $4,387.79. On the flip side, if we lose the bullish order block at $4,276.39, that's your signal that the bears are taking control. A breakdown there would target the equilibrium level at $4,233.00, which represents fair value in the current range. Below that, we're looking at the discount zone and potentially the swing low at $4,183.60, though that's a significant move that would require sustained selling pressure. The Bollinger Bands tell an interesting story too. We're trading below the middle band at $4,333.22, which adds to the neutral-to-slightly-bearish bias. The bands aren't particularly wide, suggesting low volatility, which aligns with our weak ADX reading. In these conditions, mean reversion trades often work better than trend-following strategies. Here's my trading plan for this setup. I'm not taking any immediate positions because the risk/reward simply isn't there. If you're itching to trade, wait for one of two scenarios. Scenario one: a break and 4-hour close above $4,358.99 with volume at least 50% above average. That would be your long entry signal, targeting $4,385.62 first, then $4,387.79. Your stop would go below $4,330.00, giving you about a 1:2 risk/reward ratio. Scenario two: a breakdown below $4,276.39 on a 4-hour close. That's your short entry, targeting $4,233.00 initially, with an extended target at $4,183.60 if momentum continues. Your stop would sit above $4,307.60, the top of the order block. This gives you a much better risk/reward of around 1:3 to the first target. The key invalidation level for any bullish thesis is $4,275.00. A close below that breaks the demand zone structure and confirms bearish control. For bears, a reclaim of $4,358.99 would invalidate the short setup and suggest the bulls are regaining strength. One more thing to watch: the wick analysis shows 83.9% lower wick versus 16.1% upper wick on the recent candle. This suggests buyers are stepping in at lower prices, but they're not strong enough to push price higher. It's defensive buying, not aggressive accumulation. That's another reason to wait for clearer signals. Bottom line: this is a WAIT situation. The market is in consolidation mode with weak trend strength, conflicting signals, and terrible volume. Forcing trades in these conditions is how accounts get chopped up. Let the market show its hand first. Either we get a clean breakout above $4,358.99 or a breakdown below $4,276.39. Until then, preserve your capital and wait for a high-probability setup. What's your take on gold right now - are you seeing something I'm missing, or are you also sitting on your hands waiting for clarity?
MonoCoinSignal
بیت کوین در آستانه انفجار است؟ تحلیل ساختار مخفی و سطوح کلیدی برای رشد صعودی
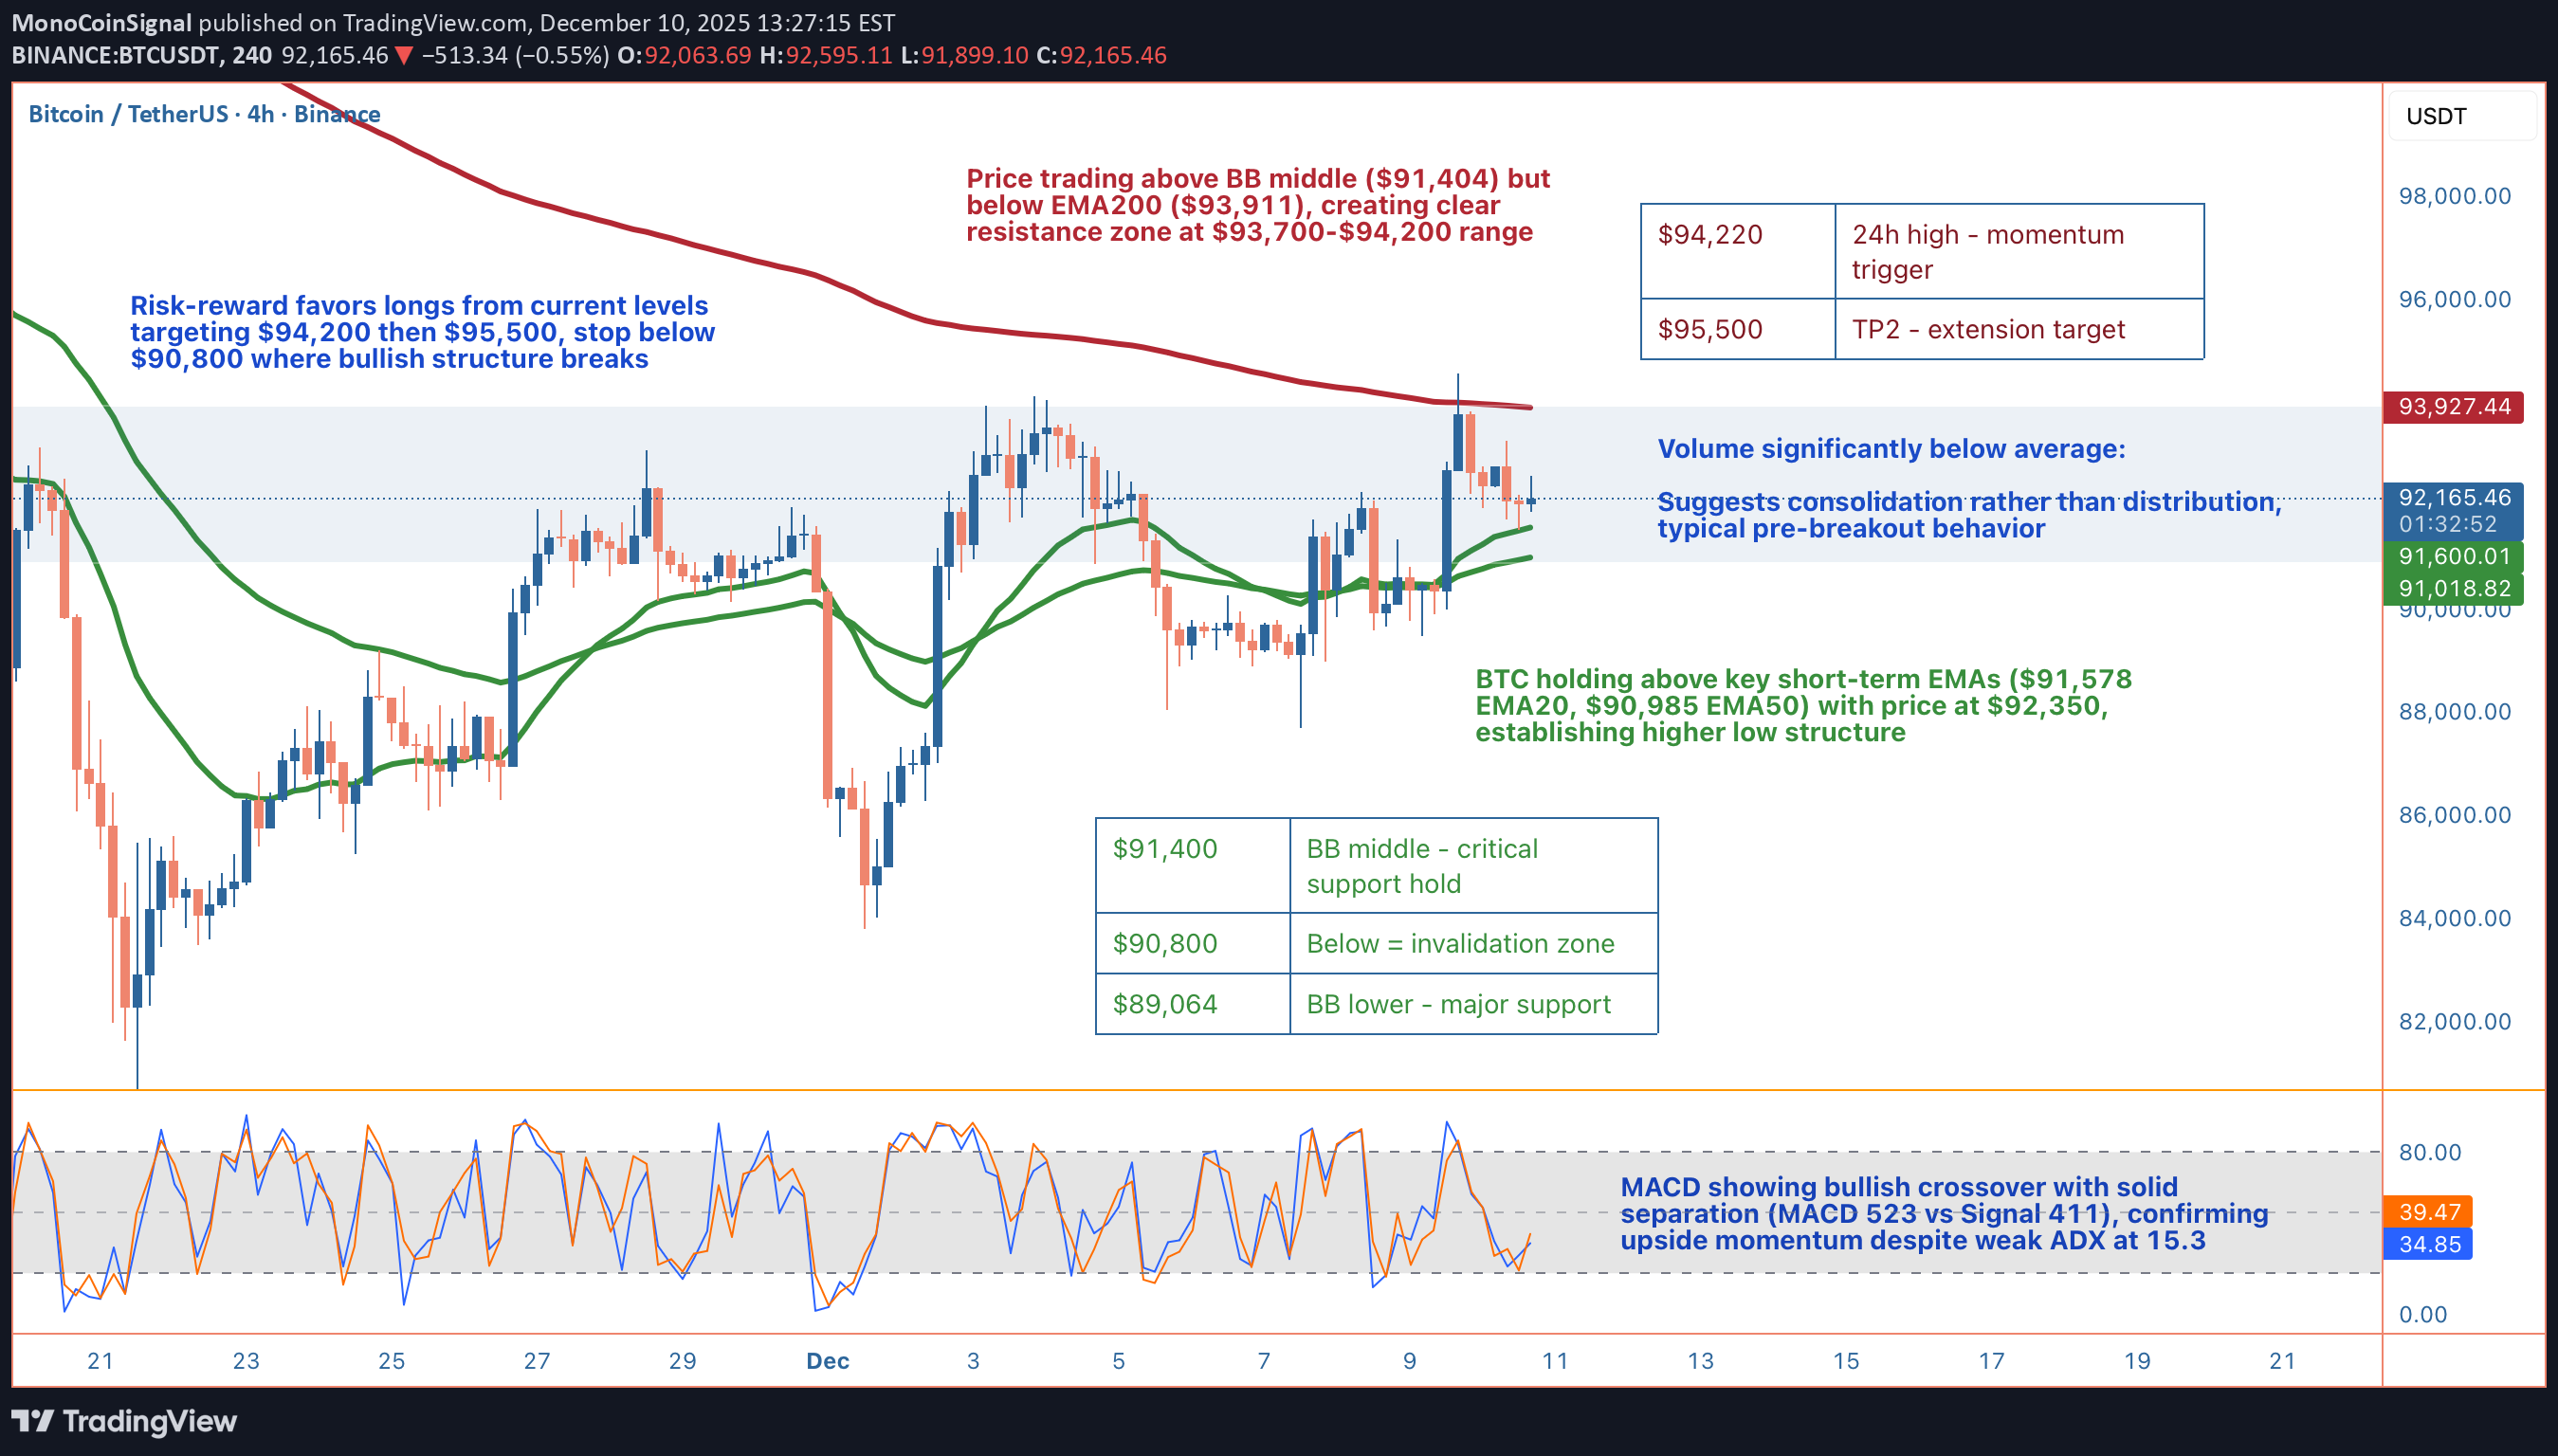
Hey guys, BTC's setting up an intriguing consolidation pattern at $92,350 after getting rejected from yesterday's $94,221 high, and the technical structure underneath is telling a pretty bullish story despite the surface-level chop. Let me break down what I'm seeing across multiple timeframes and why this could be gearing up for the next leg higher. On the 4-hour chart, we're dealing with a classic post-rejection consolidation phase. Price pulled back -1.40% from the 24h high but found solid support right at the EMA20 ($91,578) and has been coiling above it ever since. What's important here is the higher low structure that's forming, BTC bounced from $91,520 (24h low) and hasn't retested that level, instead building a base above $92,000. This is textbook bullish price action where dips are getting bought rather than cascading into lower lows. The moving average stack is giving us mixed signals but leaning constructive. Price is trading above both the EMA20 ($91,578) and EMA50 ($90,985), which is your first confirmation of short-term bullish momentum. However, we're still below the EMA200 at $93,911, which is acting as the major resistance ceiling right now. This creates a clear battleground zone between $92,000 support and $94,000 resistance. The HMA55 at $91,458 is providing additional support confluence, reinforcing that $91,400-$91,500 zone as a critical floor. Diving into the momentum indicators, the MACD is showing a bullish crossover with solid separation (MACD line at 523 vs Signal at 411). This 112-point spread indicates genuine upside momentum building beneath the surface, even though price action looks choppy. The histogram is expanding positively, which typically precedes price following momentum higher. Now, the ADX at 15.3 tells us we're in a weak trend environment, but don't mistake that for bearish. Low ADX during consolidation often means the market is coiling energy for the next directional move, and with MACD bullish, that move is more likely to be upward. RSI at 52.2 sits perfectly neutral with massive room to run before hitting overbought territory at 70. This is ideal for swing longs because you're not buying into extended conditions. The Stochastic at 57.0 mirrors this neutrality, while the MFI (Money Flow Index) at 42.8 is particularly interesting. MFI below 50 during a consolidation phase with price holding support suggests we're not seeing heavy distribution from smart money. If whales were dumping, MFI would be diving toward oversold while price breaks support, that's not happening here. Bollinger Bands are providing clear technical boundaries for this setup. Price is trading above the middle band at $91,404, which has flipped from resistance to support, a bullish development. The upper band sits at $93,744, just below that critical EMA200 at $93,911, creating a resistance cluster in the $93,700-$94,200 range. The lower band at $89,064 represents the extreme downside scenario, but we'd need to lose multiple support layers to get there. The current BB position (above middle, below upper) is typical of consolidation before continuation moves. Volume analysis is revealing. Current volume at $12,060 is significantly below the average of $26,267, sitting at roughly 46% of normal activity. In isolation, low volume might seem bearish, but context matters. When price consolidates on low volume above key support levels, it typically indicates larger players aren't actively selling, they're waiting. Distribution phases show high volume with price failing to make progress. This looks more like accumulation or at minimum, a lack of selling pressure. Once volume returns, if it comes with upside price action, that's your breakout confirmation signal. The wick analysis adds another layer of insight. Upper wicks at 33.9% versus lower wicks at 24.1% shows sellers are stepping in at higher prices (around that $93,700-$94,200 resistance zone), but buyers are absorbing that selling pressure without letting price collapse. This tug-of-war is creating the consolidation, but the fact that we're holding above $92,000 despite repeated upper wick rejections suggests demand is strong enough to eventually push through supply. Looking at support and resistance levels with precision: Immediate support sits at $92,000 (psychological level), then $91,578 (EMA20), followed by $91,404 (BB middle). The critical support that must hold for bulls is $90,985 (EMA50), with final line in the sand at $90,800. Below $90,800, the higher low structure breaks and we'd likely see a flush toward $89,064 (BB lower) or even $88,500. On the upside, resistance layers at $93,744 (BB upper), $93,911 (EMA200), and $94,221 (24h high). A break and hold above $94,200 would be significant, flipping the EMA200 from resistance to support and likely triggering momentum algorithms. For a concrete trading setup, here's what I'm watching: Entry zone is $92,000-$92,500, essentially current levels where we're consolidating. This gives you a defined risk entry rather than chasing breakouts. Stop loss goes at $90,800, which represents the invalidation point where the bullish structure breaks (losing EMA50 and higher low pattern). That's roughly a 1.6% risk from current price. Take profit targets: TP1 at $94,200 (2.0% gain, 1:1.25 R/R) for the conservative BB upper breakout, TP2 at $95,500 (3.4% gain, 1:2.1 R/R) for the EMA200 reclaim with extension, and TP3 at $97,000 (5.0% gain, 1:3.1 R/R) for those riding momentum. Scale out at each level to lock profits while leaving room to catch a larger move. The key trigger to watch is volume returning on the breakout attempt. If BTC pushes toward $93,700-$94,000 and volume surges above the $26,267 average, that's your confirmation to add to positions or enter if you missed the initial setup. Conversely, if we approach resistance on weak volume (sub $15,000), that's a fade opportunity rather than a buy signal, expect rejection back to $92,000 support. Risk-reward clearly favors the long side here with 1:2 to 1:3 setups available, solid moving average support underneath, bullish MACD momentum, and neutral oscillators with room to run. The main risk is a macro catalyst or sudden volume spike that breaks $90,800 support, but technically, the path of least resistance appears to be higher once this consolidation resolves. What are you thinking here, are you playing this consolidation for the breakout or waiting for clearer confirmation above $94,000?Got another rejection from EMA200 (Red line on the chart)BTC's grinding sideways at $90,092 after 15 hours of choppy price action, and the technical setup remains bearish despite oversold conditions. We're still trapped below all major EMAs (20/50/200) with MACD deeply negative at -285.18, but the real story is the trend exhaustion - ADX collapsed to just 11.7, signaling we're in a weak, directionless environment. 📉 The Stochastic hit 19.4 (oversold) and that 27.4% lower wick shows buyers defending current levels, but the 72.4% upper wick and collapsed volume ($160 vs $2,718 avg) tell us sellers are still in control on any bounce attempts. From a Smart Money perspective, we've got an unfilled bearish FVG from $92,044 to $90,666 acting as supply overhead, and price is sitting in the bullish order block between $90,528 and $89,500. The immediate support at $89,480 (24h low) looks vulnerable if we lose this demand zone, with the next major level at $87,719 (strong swing low in the discount zone). That's where I'd expect real buyers to step in aggressively. 🎯 The trade setup favors shorts from current levels ($90,000-$90,500) with stops above $92,044 (bearish FVG top - that's the invalidation level). First target is $89,480 (TP1), then $87,719 (TP2) for a 1:2.3 risk/reward. Just be aware that with ADX this low, we could chop around in this range for a while before making the next decisive move. If we get a 4H close above $92,044, the bearish thesis is off and you need to reassess.
MonoCoinSignal
TRX در آستانه انفجار صعودی؟ سیگنالهای خرید قوی از منطقه اشباع فروش!
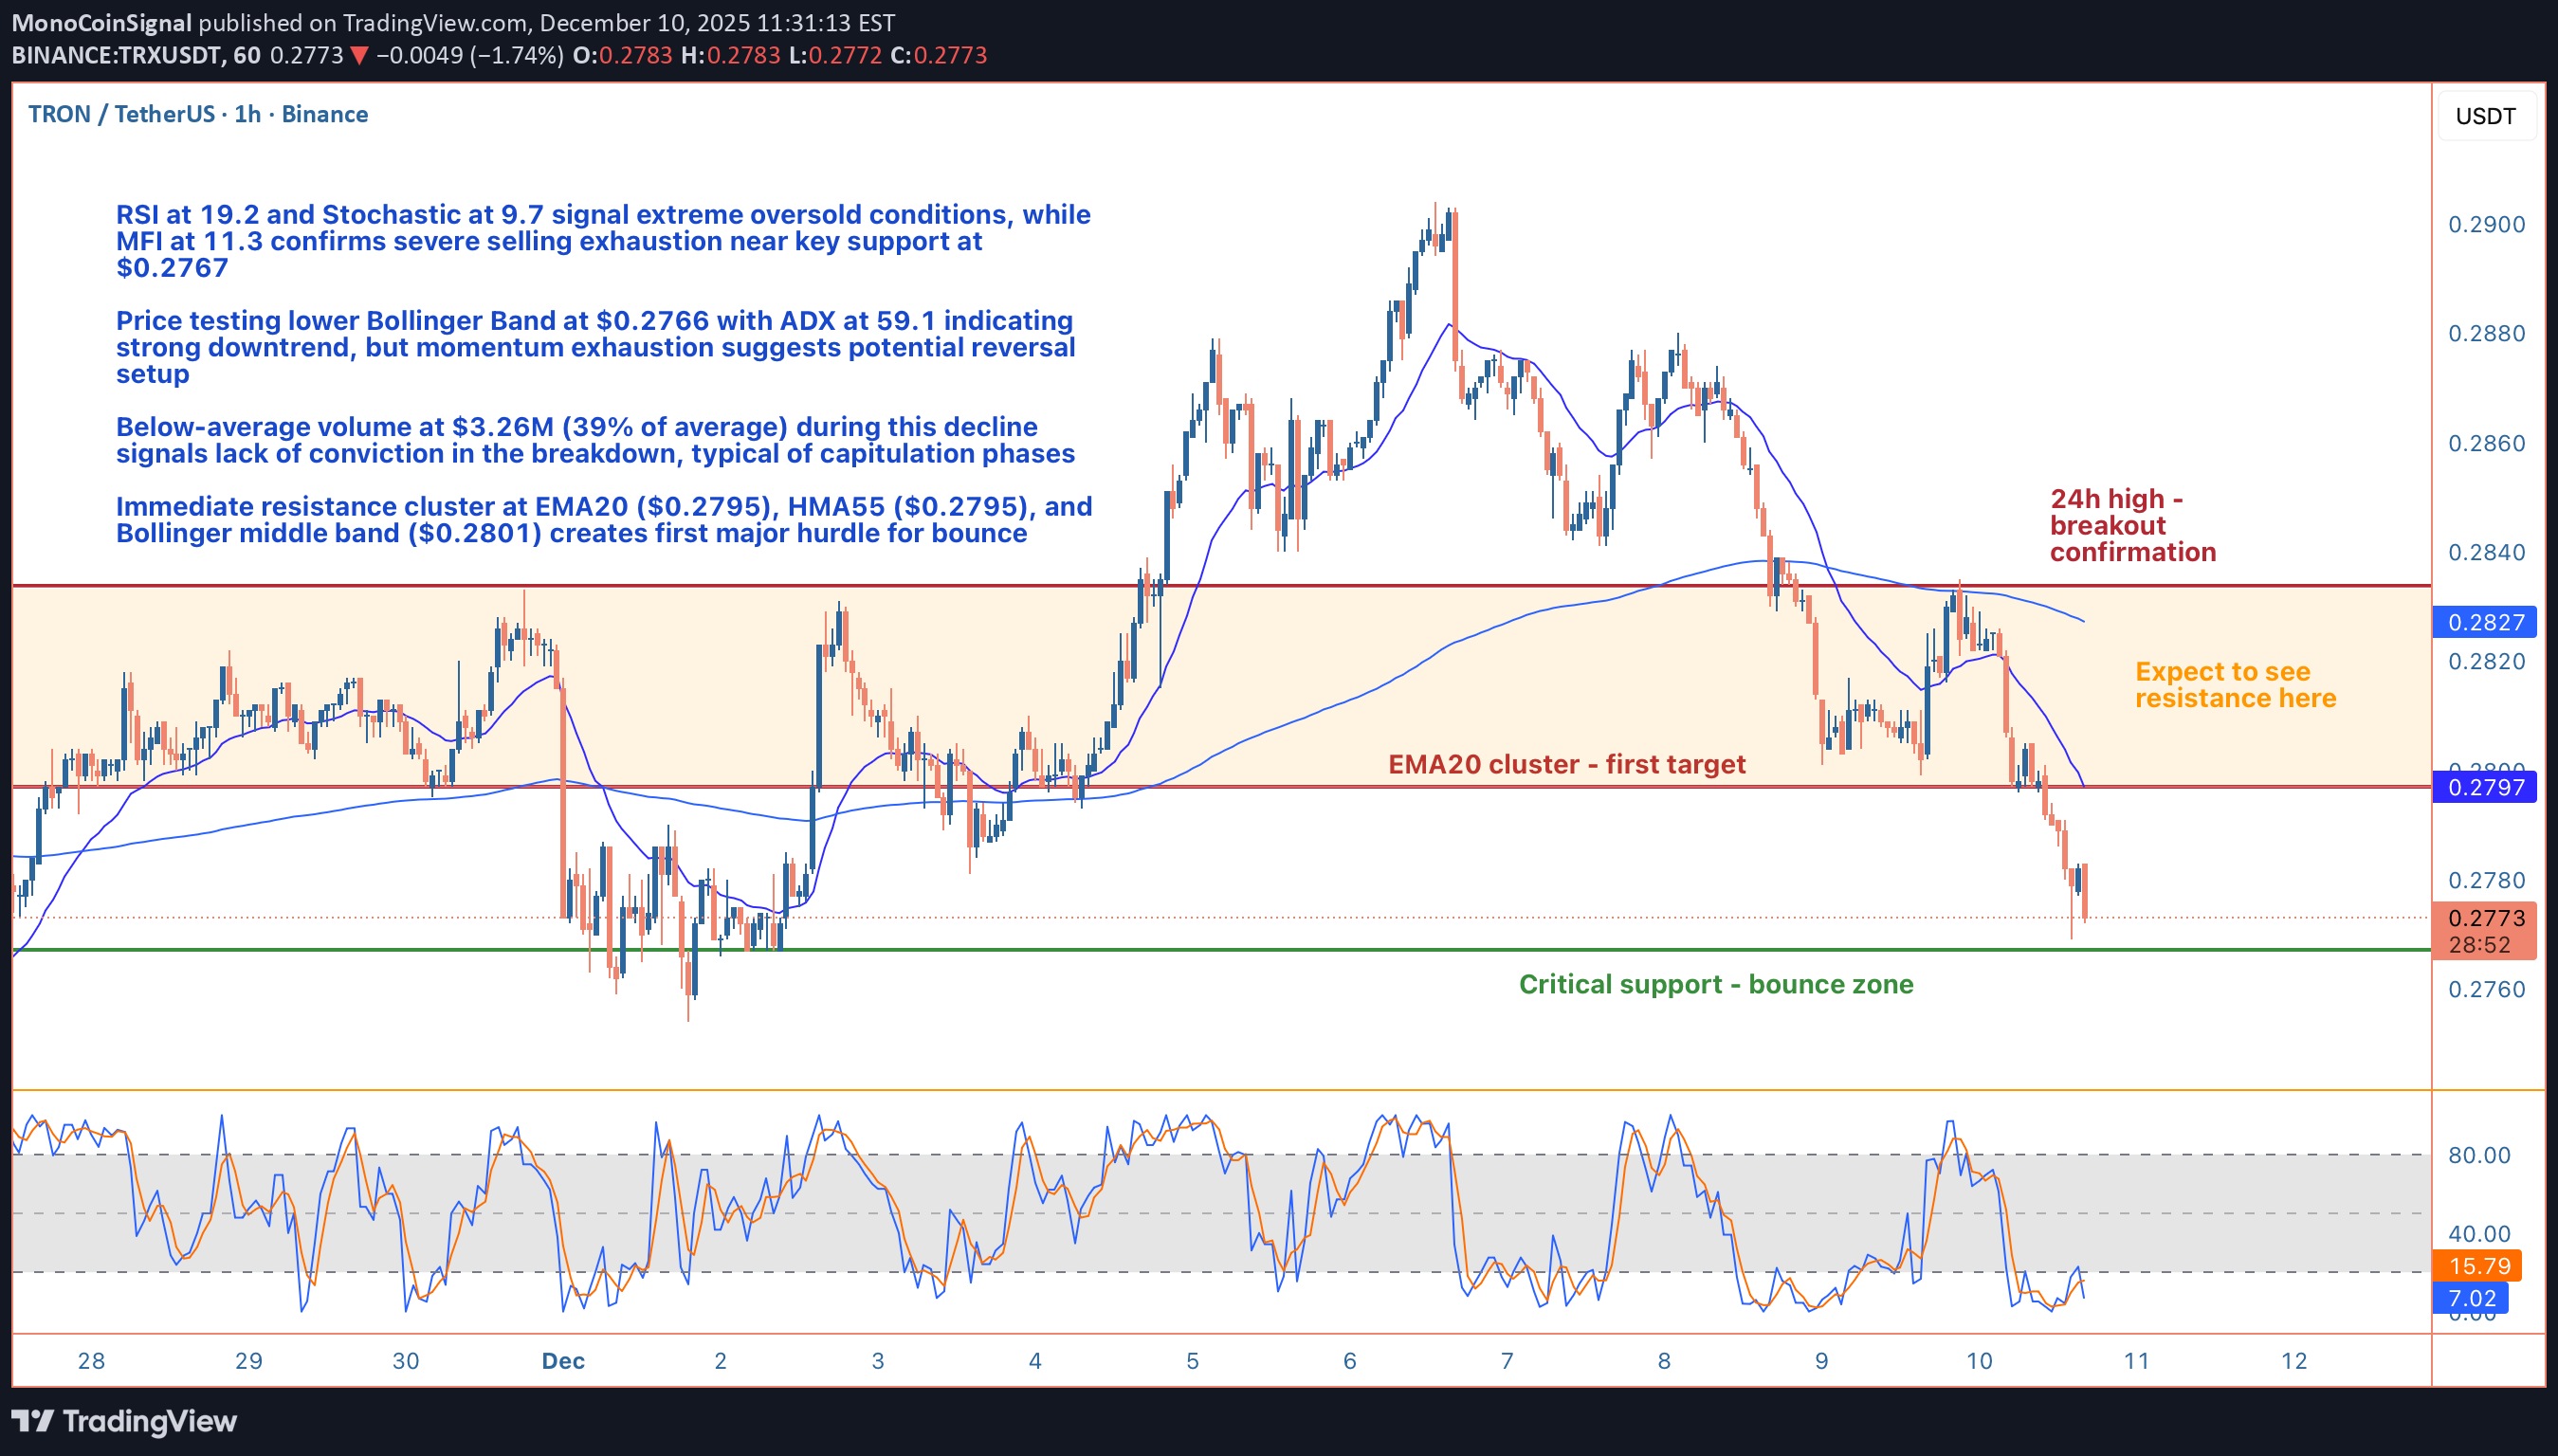
Hey guys, let's break down what's happening with Tron on the 1-hour timeframe because we're seeing some textbook oversold conditions that could set up a solid mean reversion play. TRX is currently trading at $0.2772, down 1.29% over the last 24 hours and sitting dangerously close to the daily low at $0.2767. The price action has been grinding lower throughout the session, but what's really catching my eye is the confluence of extreme oversold readings across multiple momentum oscillators. RSI has crashed to 19.2, Stochastic is pinned at 9.7, and Money Flow Index is absolutely wrecked at 11.3 - these are capitulation-level numbers that we don't see every day. When you get RSI below 20 and Stochastic under 10 simultaneously, you're typically looking at selling exhaustion rather than the start of a fresh breakdown. The ADX reading of 59.1 confirms we're in a strong trending environment, but here's the thing: strong trends paired with extreme oversold conditions often mark the final flush before a bounce. Price is literally kissing the lower Bollinger Band at $0.2766, which has been acting as a technical support floor. The 4.5% lower wick on recent candles tells us buyers are already starting to defend these levels, even if hesitantly. From a moving average perspective, the picture is clearly bearish. TRX is trading below the EMA20 ($0.2795), EMA50 ($0.2811), and EMA200 ($0.2825), with a confirmed lower high formation that validates the downtrend structure. The HMA55 sits at $0.2795, creating a resistance cluster right around that EMA20 level. This convergence zone between $0.2795 and $0.2801 (Bollinger middle band) is going to be your first major hurdle on any bounce attempt. The MACD remains bearish with the histogram negative (MACD at -0.0011, Signal at -0.0008), so we're definitely fighting against the prevailing momentum here. But here's where it gets interesting: volume analysis is showing a completely different story. Current volume sits at just $3.26M compared to the 24-hour average of $8.43M - that's only 39% of normal activity. When you see price making new lows on significantly below-average volume, it's a red flag that the move lacks conviction. Sellers aren't piling in with force here; instead, we're seeing passive drifting lower, which often precedes reversals. The 24-hour volume of $64.7M is decent, but the intraday weakness in participation suggests this decline is running on fumes. Let's talk support and resistance levels because these are critical for framing any trade setup. Immediate support is the 24-hour low at $0.2767, which coincides almost perfectly with the lower Bollinger Band at $0.2766. This is your line in the sand - hold here and we're looking at a bounce; break below with volume and the oversold condition could extend further (though that seems less likely given current momentum exhaustion). On the upside, first resistance is that EMA20/HMA55 cluster at $0.2795, followed quickly by the Bollinger middle band at $0.2801. These levels will likely act as magnets for any mean reversion move. Beyond that initial resistance zone, the EMA50 at $0.2811 and EMA200 at $0.2825 represent more substantial barriers. The EMA200 in particular is significant because it's been capping rallies and would mark a full retracement of today's decline. The 24-hour high at $0.2834 sits just above that and represents the upper boundary of today's range - breaking above that would flip the short-term structure and potentially signal a trend reversal rather than just a bounce. For a trading setup, I'm favoring a counter-trend long position here with tight risk management. Entry zone would be in the $0.2770 area, essentially current price levels while we're testing support. Your stop loss needs to be tight given we're fighting the trend - I'd place it below $0.2760 to give about 10 pips of breathing room below the support cluster. That's roughly a $0.001 risk per unit. Take profit targets would be layered: TP1 at $0.2795 (EMA20/HMA55, about 2.5:1 RR), TP2 at $0.2801 (Bollinger middle band, about 3:1 RR), and TP3 at $0.2825 (EMA200, roughly 5.5:1 RR) for those wanting to ride extended bounces. The risk-reward here is favorable if you're disciplined with your stops. This isn't a high-conviction trend-following setup - it's a tactical mean reversion play based on extreme oversold conditions and weak selling volume. The confidence level sits around 73%, which reflects the fact that we're trading against the prevailing trend but with strong technical justification from momentum indicators. You're essentially betting that the rubber band has stretched too far and needs to snap back toward the mean. One scenario to watch: if we do get that bounce to the $0.2795-$0.2801 zone and price gets rejected hard with increasing volume, that would actually be a great short setup for continuation lower. But right now, at these oversold levels with price testing support, the path of least resistance for a short-term move appears to be up rather than down. The bearish structure remains intact on higher timeframes, so this would be a scalp rather than a swing trade - get in, take profits at resistance, and don't overstay your welcome. What are you thinking on this setup? Are you comfortable fading this weakness for a bounce, or would you rather wait for confirmation above $0.2795 before getting involved?Hit the entry level (green support on chart), and reached the first target.
MonoCoinSignal
SHIB fighting EMA
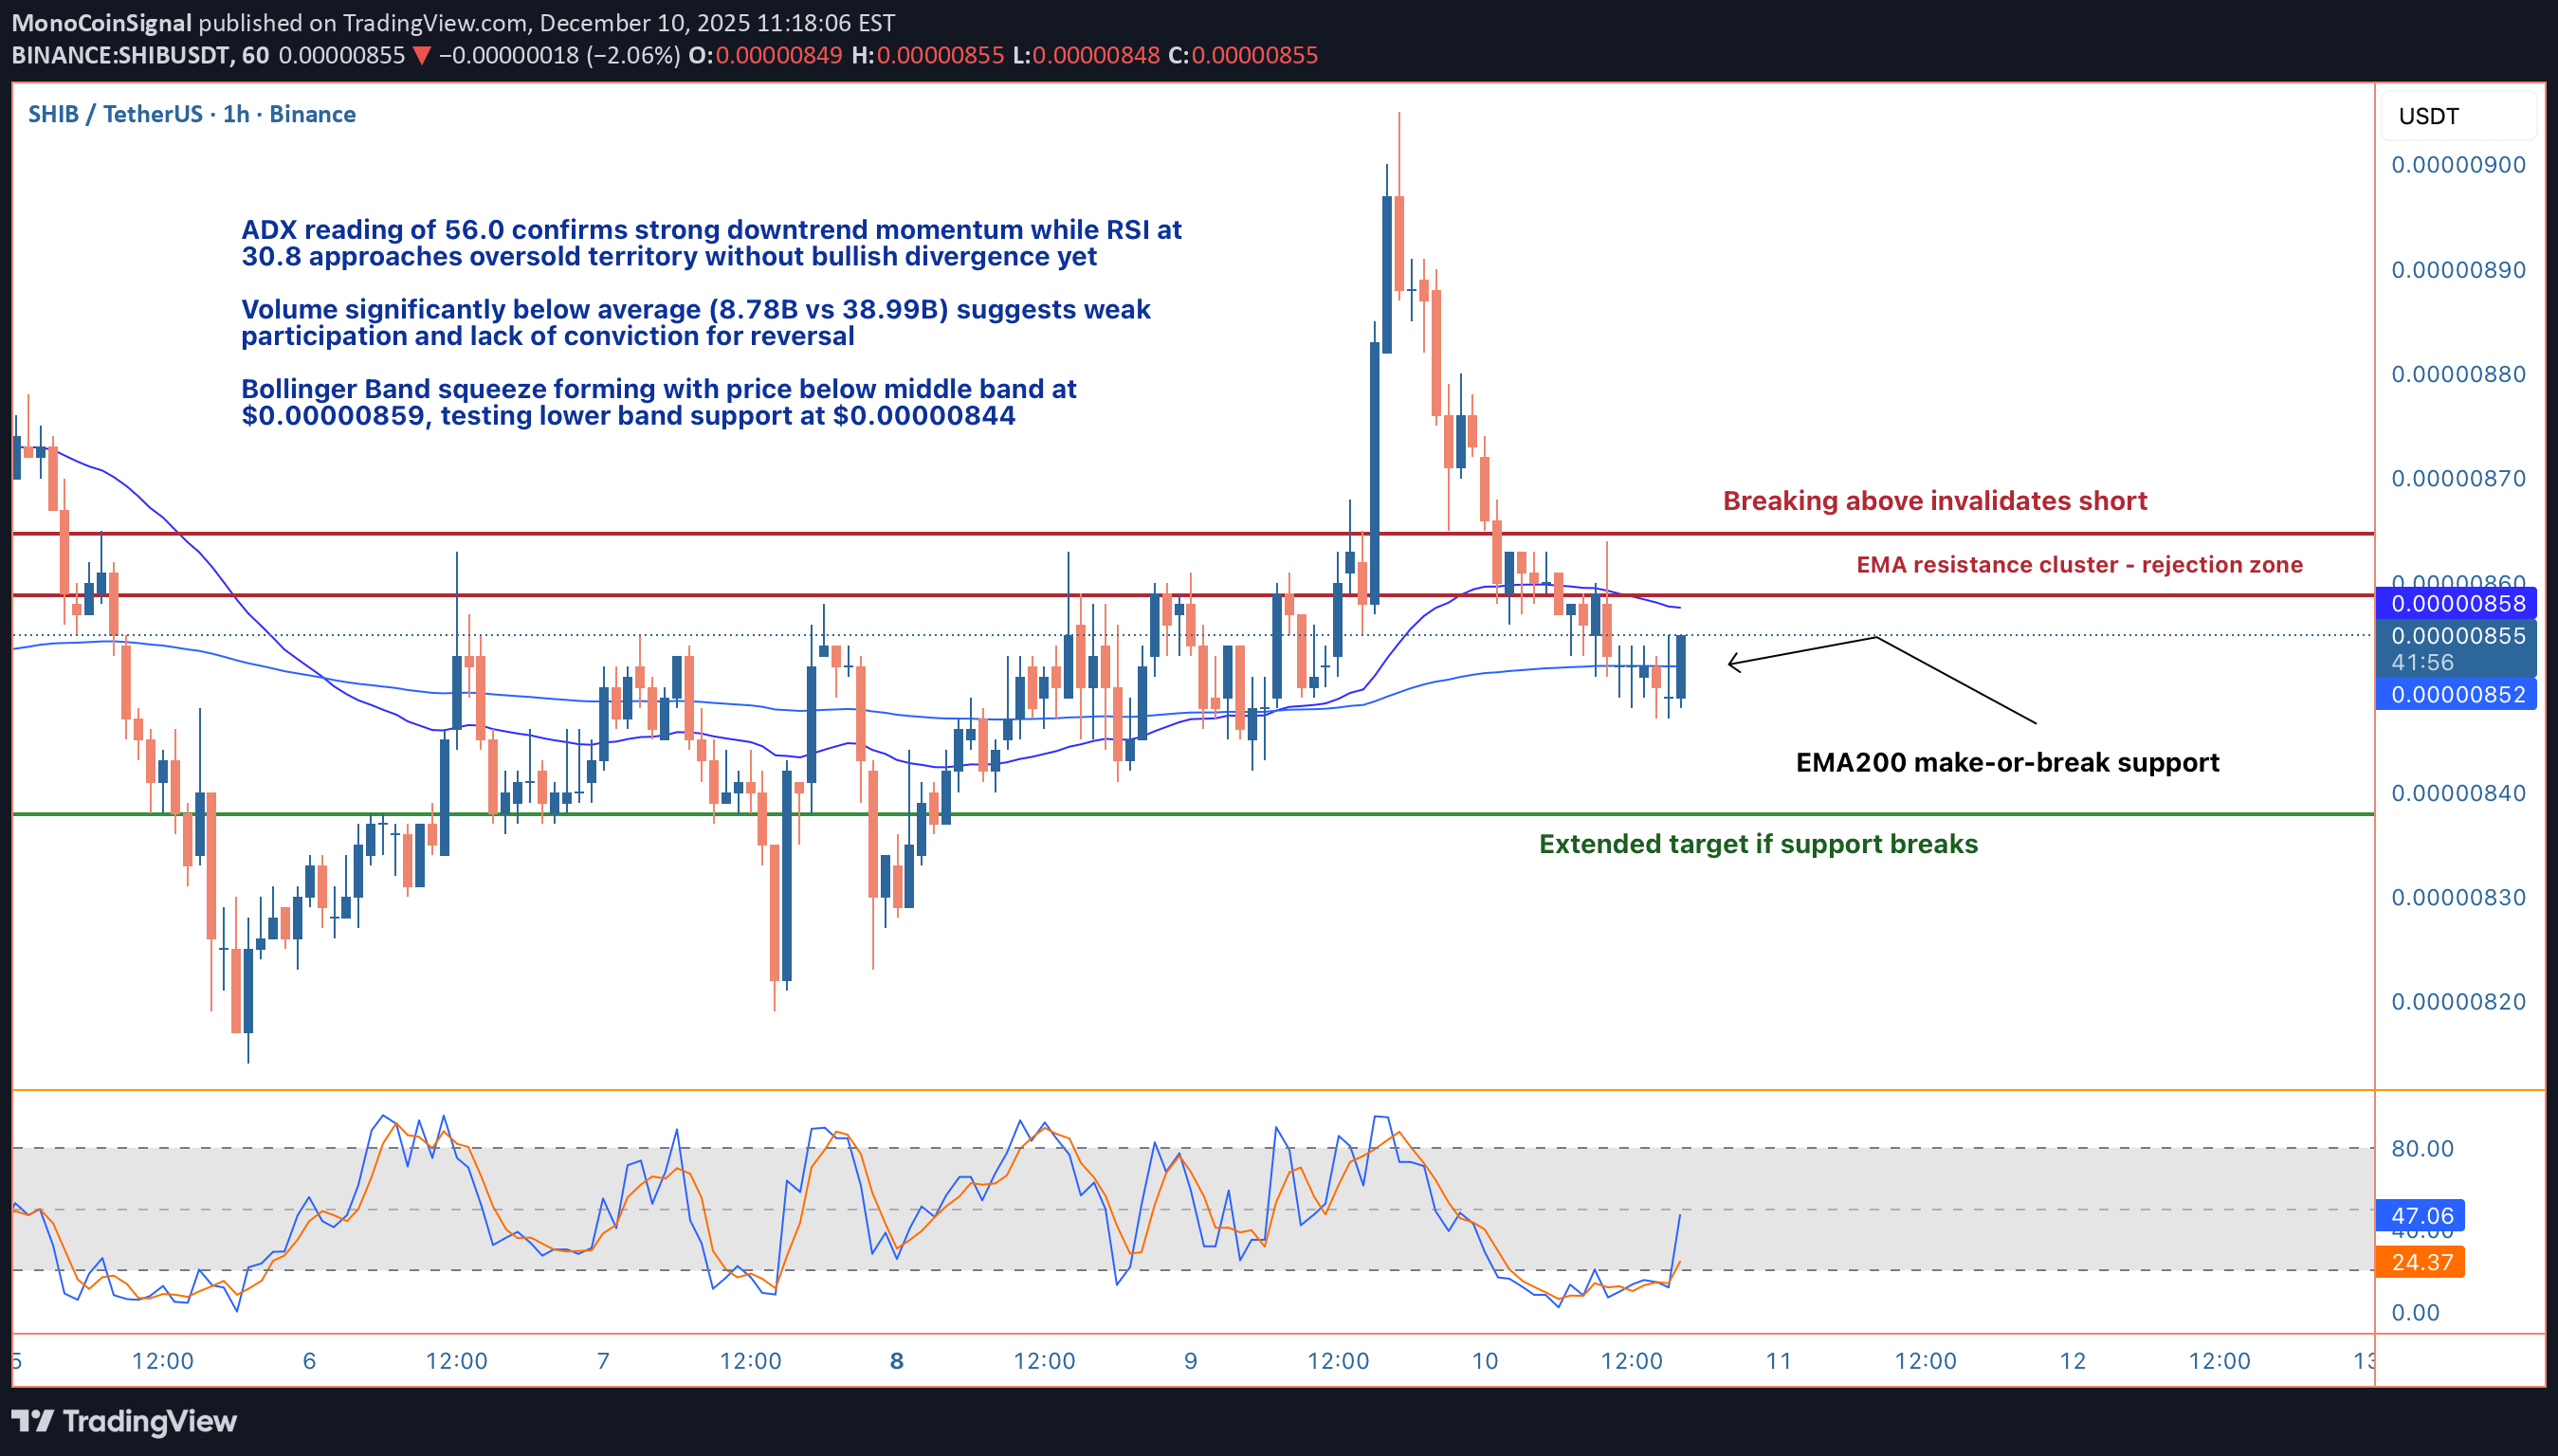
سلام بچه ها، SHIB برای یک شکست احتمالی در بازه زمانی 1H آماده می شود، و پاداش ریسک در حال حاضر برای موقعیت های کوتاه بسیار تمیز به نظر می رسد. قیمت با قیمت 0.00000853 دلار معامله می شود، بین مقاومت EMA20/50 در 0.00000857-858 دلار و پشتیبانی make-or-break EMA200 در 0.00000852 دلار قرار می گیرد. خواندن ADX 56.0 تأیید می کند که ما در یک محیط روند قوی هستیم و این روند قطعاً نزولی است. RSI در 30.8 به فروش بیش از حد نزدیک می شود، اما بدون واگرایی صعودی و با حجم پایین تر از 77 درصد، هنوز هیچ قطعیتی برای برگشت وجود ندارد. راهاندازی: ورودیهای کوتاه حدود 0.00000855 دلار با توقف محکم بالای 0.00000865 دلار (اگر خوشه EMA را بازیابی کنیم، باطل میشود). هدف اول در Bollinger Band پشتیبانی کمتر در $0.00000844 قرار دارد، با هدف افزایش یافته در $0.00000838 در صورت شکست EMA200. این به ما تقریباً 1:2.5 پاداش ریسک در مورد هدف محافظه کارانه و 1:4+ در صورت دریافت move کامل می دهد. MACD نزولی باقی می ماند، MFI پول ضعیف flow را در 36.5 نشان می دهد، و وضعیت بازار داخلی تنها با اطمینان جهتی 17 درصد متلاطم می خواند، اما سیگنال های فروش در حال انباشته شدن هستند. ریسک کلیدی: اگر قیمت 0.00000859 دلار (BB وسط band) با حجم بازیابی شود، کل این تنظیمات باطل میشود و میتوانیم شاهد کاهش مجدد به سمت 0.00000874 دلار باشیم. اما تا زمانی که این اتفاق نیفتد، مسیر کمترین مقاومت پایین است، به خصوص با چنین مشارکت ضعیفی در پرش ها. این move را چگونه بازی می کنی؟ منتظر توقف EMA200 هستید یا از قبل موقعیت کوتاهی دارید؟
MonoCoinSignal
جریان پول قوی در ZEC: آیا صعود انفجاری ادامه مییابد؟
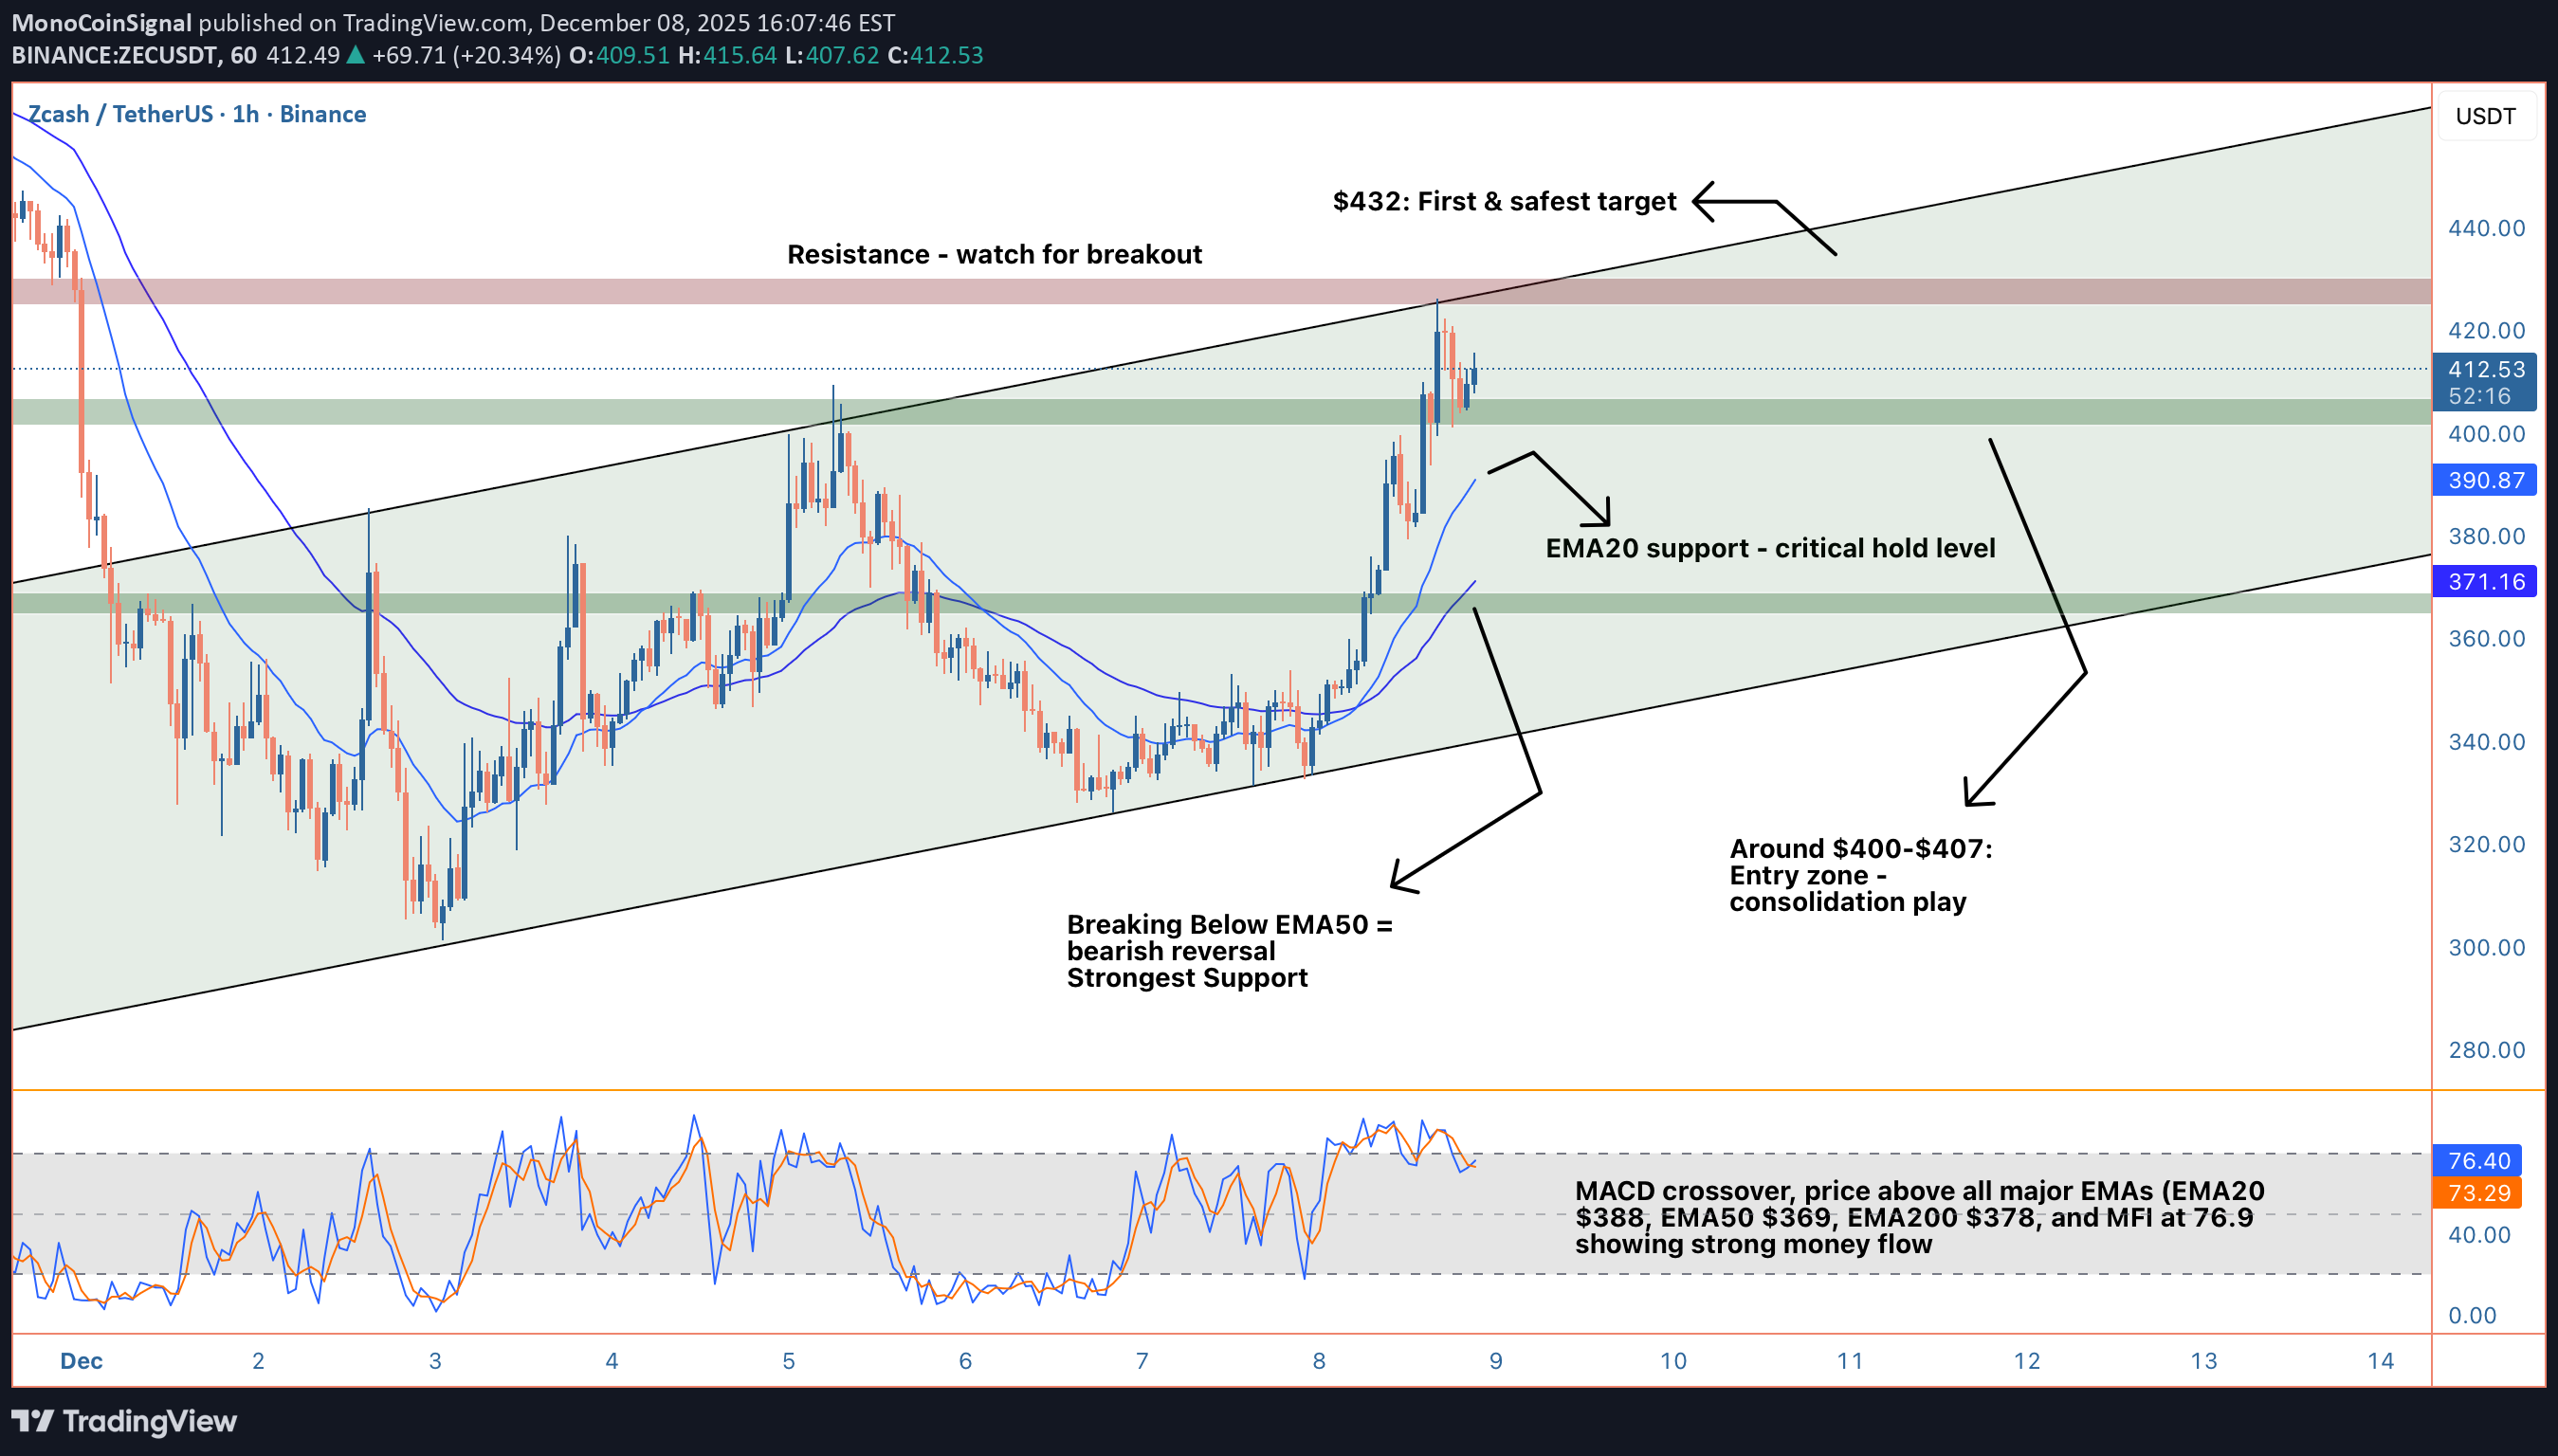
سلام بچه ها، ZEC پس از یک رالی انفجاری +17.32٪ که قیمت را از 332 دلار به 425 دلار در 24 ساعت رساند، در حال تثبیت است. اکنون با قیمت 407.75 دلار معامله میشود، ما در حال تماشای این هستیم که آیا گاوها میتوانند این سودها را هضم کنند و برای یک مرحله دیگر فشار بیاورند یا اینکه آیا ما باید اصلاحی داشته باشیم. تنظیمات فنی با تایید روند قوی، صعودی است. ADX در 69.4 سیگنال حرکت قانونی است، MACD یک متقاطع صعودی را نشان می دهد و قیمت بالاتر از همه major EMA (EMA20 $388، EMA50 $369، EMA200 $378) قرار دارد. RSI در 69.1 به بیش از حد خرید نزدیک می شود، اما هنوز جا دارد، در حالی که MFI در 76.9 نشان می دهد پول قوی flow علیرغم اینکه حجم فعلی پایین تر از حد متوسط است. سطوح کلیدی برای تماشا: پشتیبانی فوری در EMA20 388.31 دلار با پشتیبانی BB متوسط band 384.02 دلار، با پشتیبانی حیاتی در EMA50 369.27 دلار. مقاومت در بالاترین قیمت 24 ساعته 425.00 دلار و سپس BB بالاتر band 432.08 دلار است. فتیله 52.6 درصدی نشان دهنده رد شدن نزدیک به 425 دلار است که سطح شکست کلیدی ما را تشکیل می دهد. تنظیم معاملات: وارد منطقه 400 تا 410 دلار می شود، زیر EMA20 در 388 دلار متوقف می شود، 425 دلار / 445 دلار / 465 دلار را هدف قرار می دهد و ریسک / پاداش 2.1:1 تا 4.2:1 را ارائه می دهد. ساختار روند پایینترین سطح ( صعودی ) اما اوجهای پایینتر (نزولی) را نشان میدهد، که فشردهسازی ایجاد میکند که معمولاً با move قوی برطرف میشود. با اطمینان 80% و سیگنالهای خرید قوی، اگر حمایت 388 دلاری حفظ شود، به نظر میرسد که ادامه بازی یک حرکت قوی است. چگونه این move را بازی می کنید؟ اولین هدف به دست آمد
MonoCoinSignal
تحلیل تکنیکال کاردانو (ADA): آیا موج صعودی قدرتمندی در راه است؟
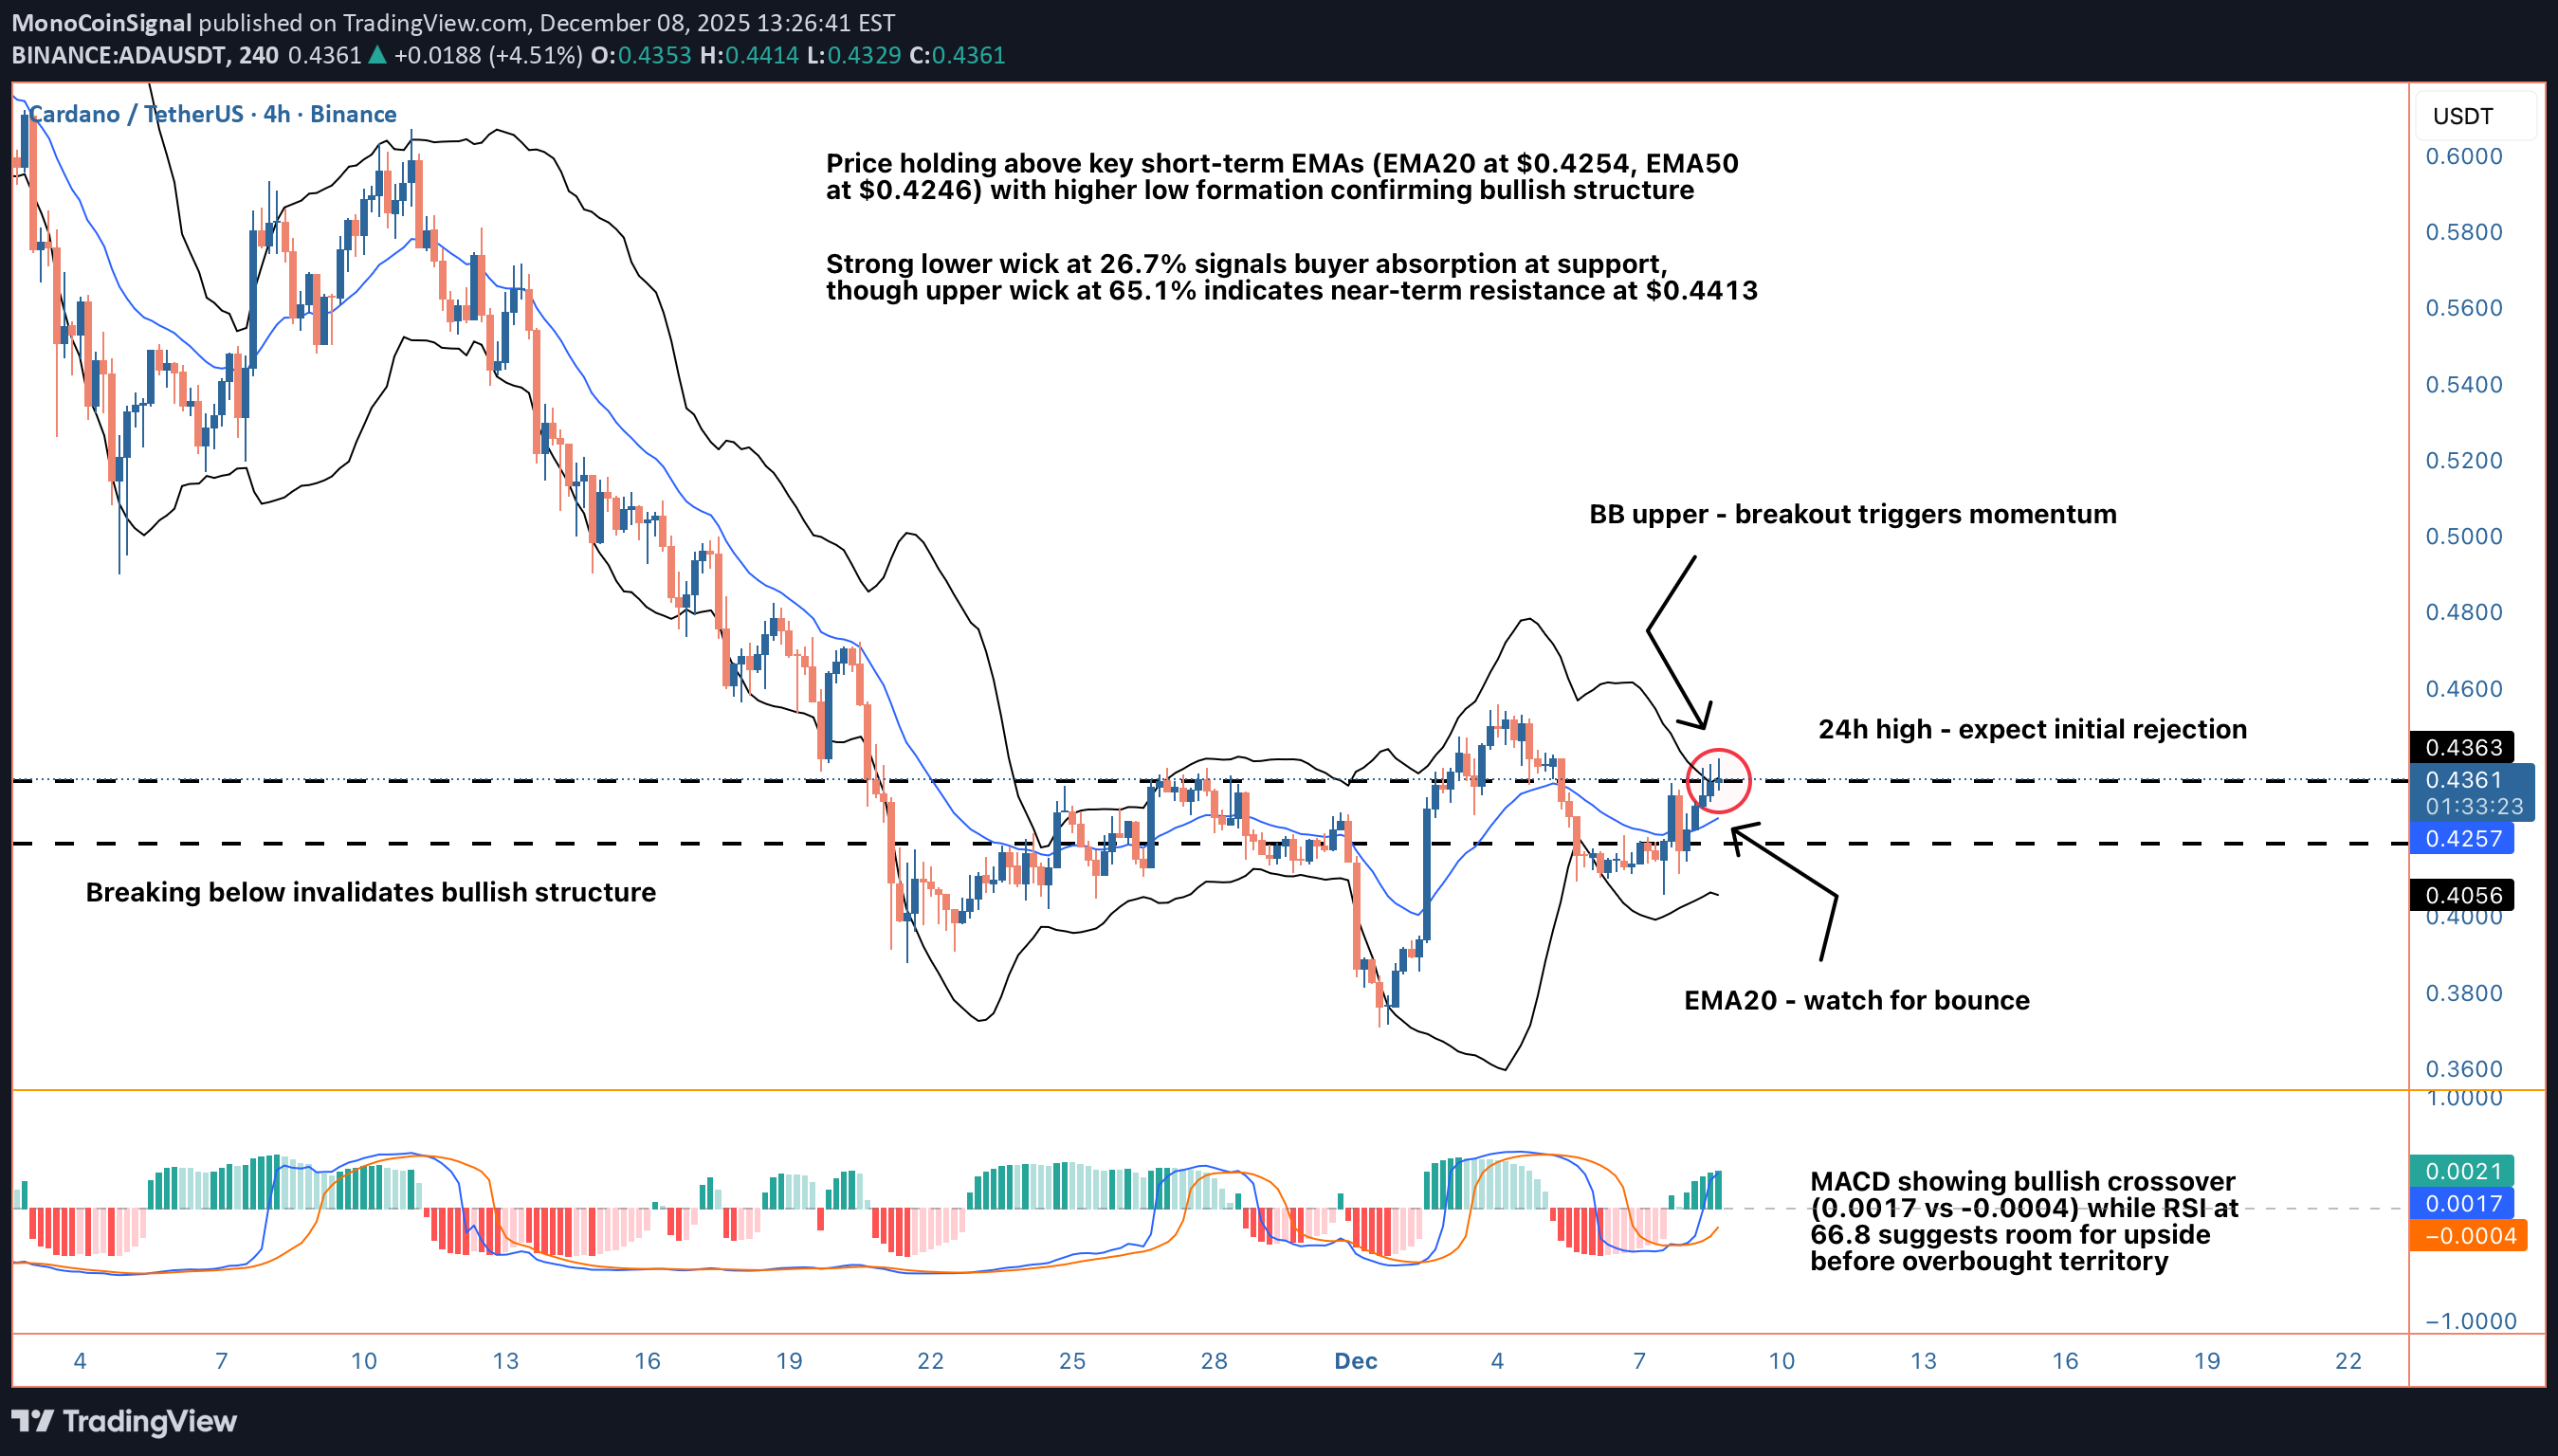
سلام بچه ها، ADA در حال آزمایش برخی از سطوح بحرانی در اینجا با قیمت 0.4357 دلار در بازه زمانی 4H است. کاردانو به سمت راست در برابر مرز بالای بولینگر Band در 0.4364 دلار پس از یک رالی محکم از پایین 0.4106 دلار حرکت می کند. این ساختار صعودی به نظر میرسد - ما شکلگیری پایینتر را تأیید کردهایم، قیمت بالاتر از EMA20 (0.4254 دلار) و EMA50 (0.4246 دلار) است و ADX در 44.7 تأیید میکند که ما در یک محیط روند قانونی به جای یکپارچگی متزلزل هستیم. MACD با یک کراس اوور جدید صعودی شد و شتاب را به تنظیمات اضافه کرد. آنچه توجه من را جلب کرد تجزیه و تحلیل فیتیله ای است که 26.7% فتیله کمتر (جذب قوی خریدار) در مقابل 65.1% فیتیله بالایی (مقاومت فروشنده 0.4413 دلار) را نشان می دهد. RSI در 66.8 به ما فضا را می دهد تا قبل از قلمروی که بیش از حد خرید شده است، حرکت کنیم، اگرچه Stochastic در 84.5 نشان می دهد که ما در کوتاه مدت طولانی تر می شویم. میزان صدا کمی کمتر از حد متوسط است که احتیاط را نشان میدهد - ما در حالت ایدهآل میخواهیم که در تلاش برای شکست، گسترش بیشتری داشته باشیم. مقاومت کلیدی در بالاترین سطح امروزی 0.4413 دلار قرار دارد، سپس اگر ما از آن عبور کنیم، 0.4500 دلار روانی بود. پشتیبانی stacks در خوشه EMA در حدود 0.4250 دلار و BB وسط در 0.4207 دلار. برای ورودیها، به جای تعقیب در سطوح فعلی، یک عقب نشینی جزئی به سمت $0.4300-$0.4340 ترجیح میدهم. زیر 0.4190 دلار (زیر تلاقی EMA) با اهداف 0.4450 دلار و 0.4550 دلار تقریباً ریسک/پاداش 1:2.5 را تنظیم می کند. رژیم روند و ساختار قیمت صعودی احتمالات را به سمت بالا متمایل می کند، اما رد فتیله بالایی در 0.4413 دلار به این معنی است که ما باید شاهد افزایش اعتماد خریداران باشیم. اگر پشتیبانی EMA20 را آزمایش کنیم، مراقب باشید که قیمت چگونه واکنش نشان میدهد - یک جهش تمیز در آنجا پتانسیل ادامه را تأیید میکند. این move را چطور بازی می کنی؟
MonoCoinSignal
فشردهسازی لحظهای XRP: آیا سقوط به زیر ۲.۰۷ قطعی است؟
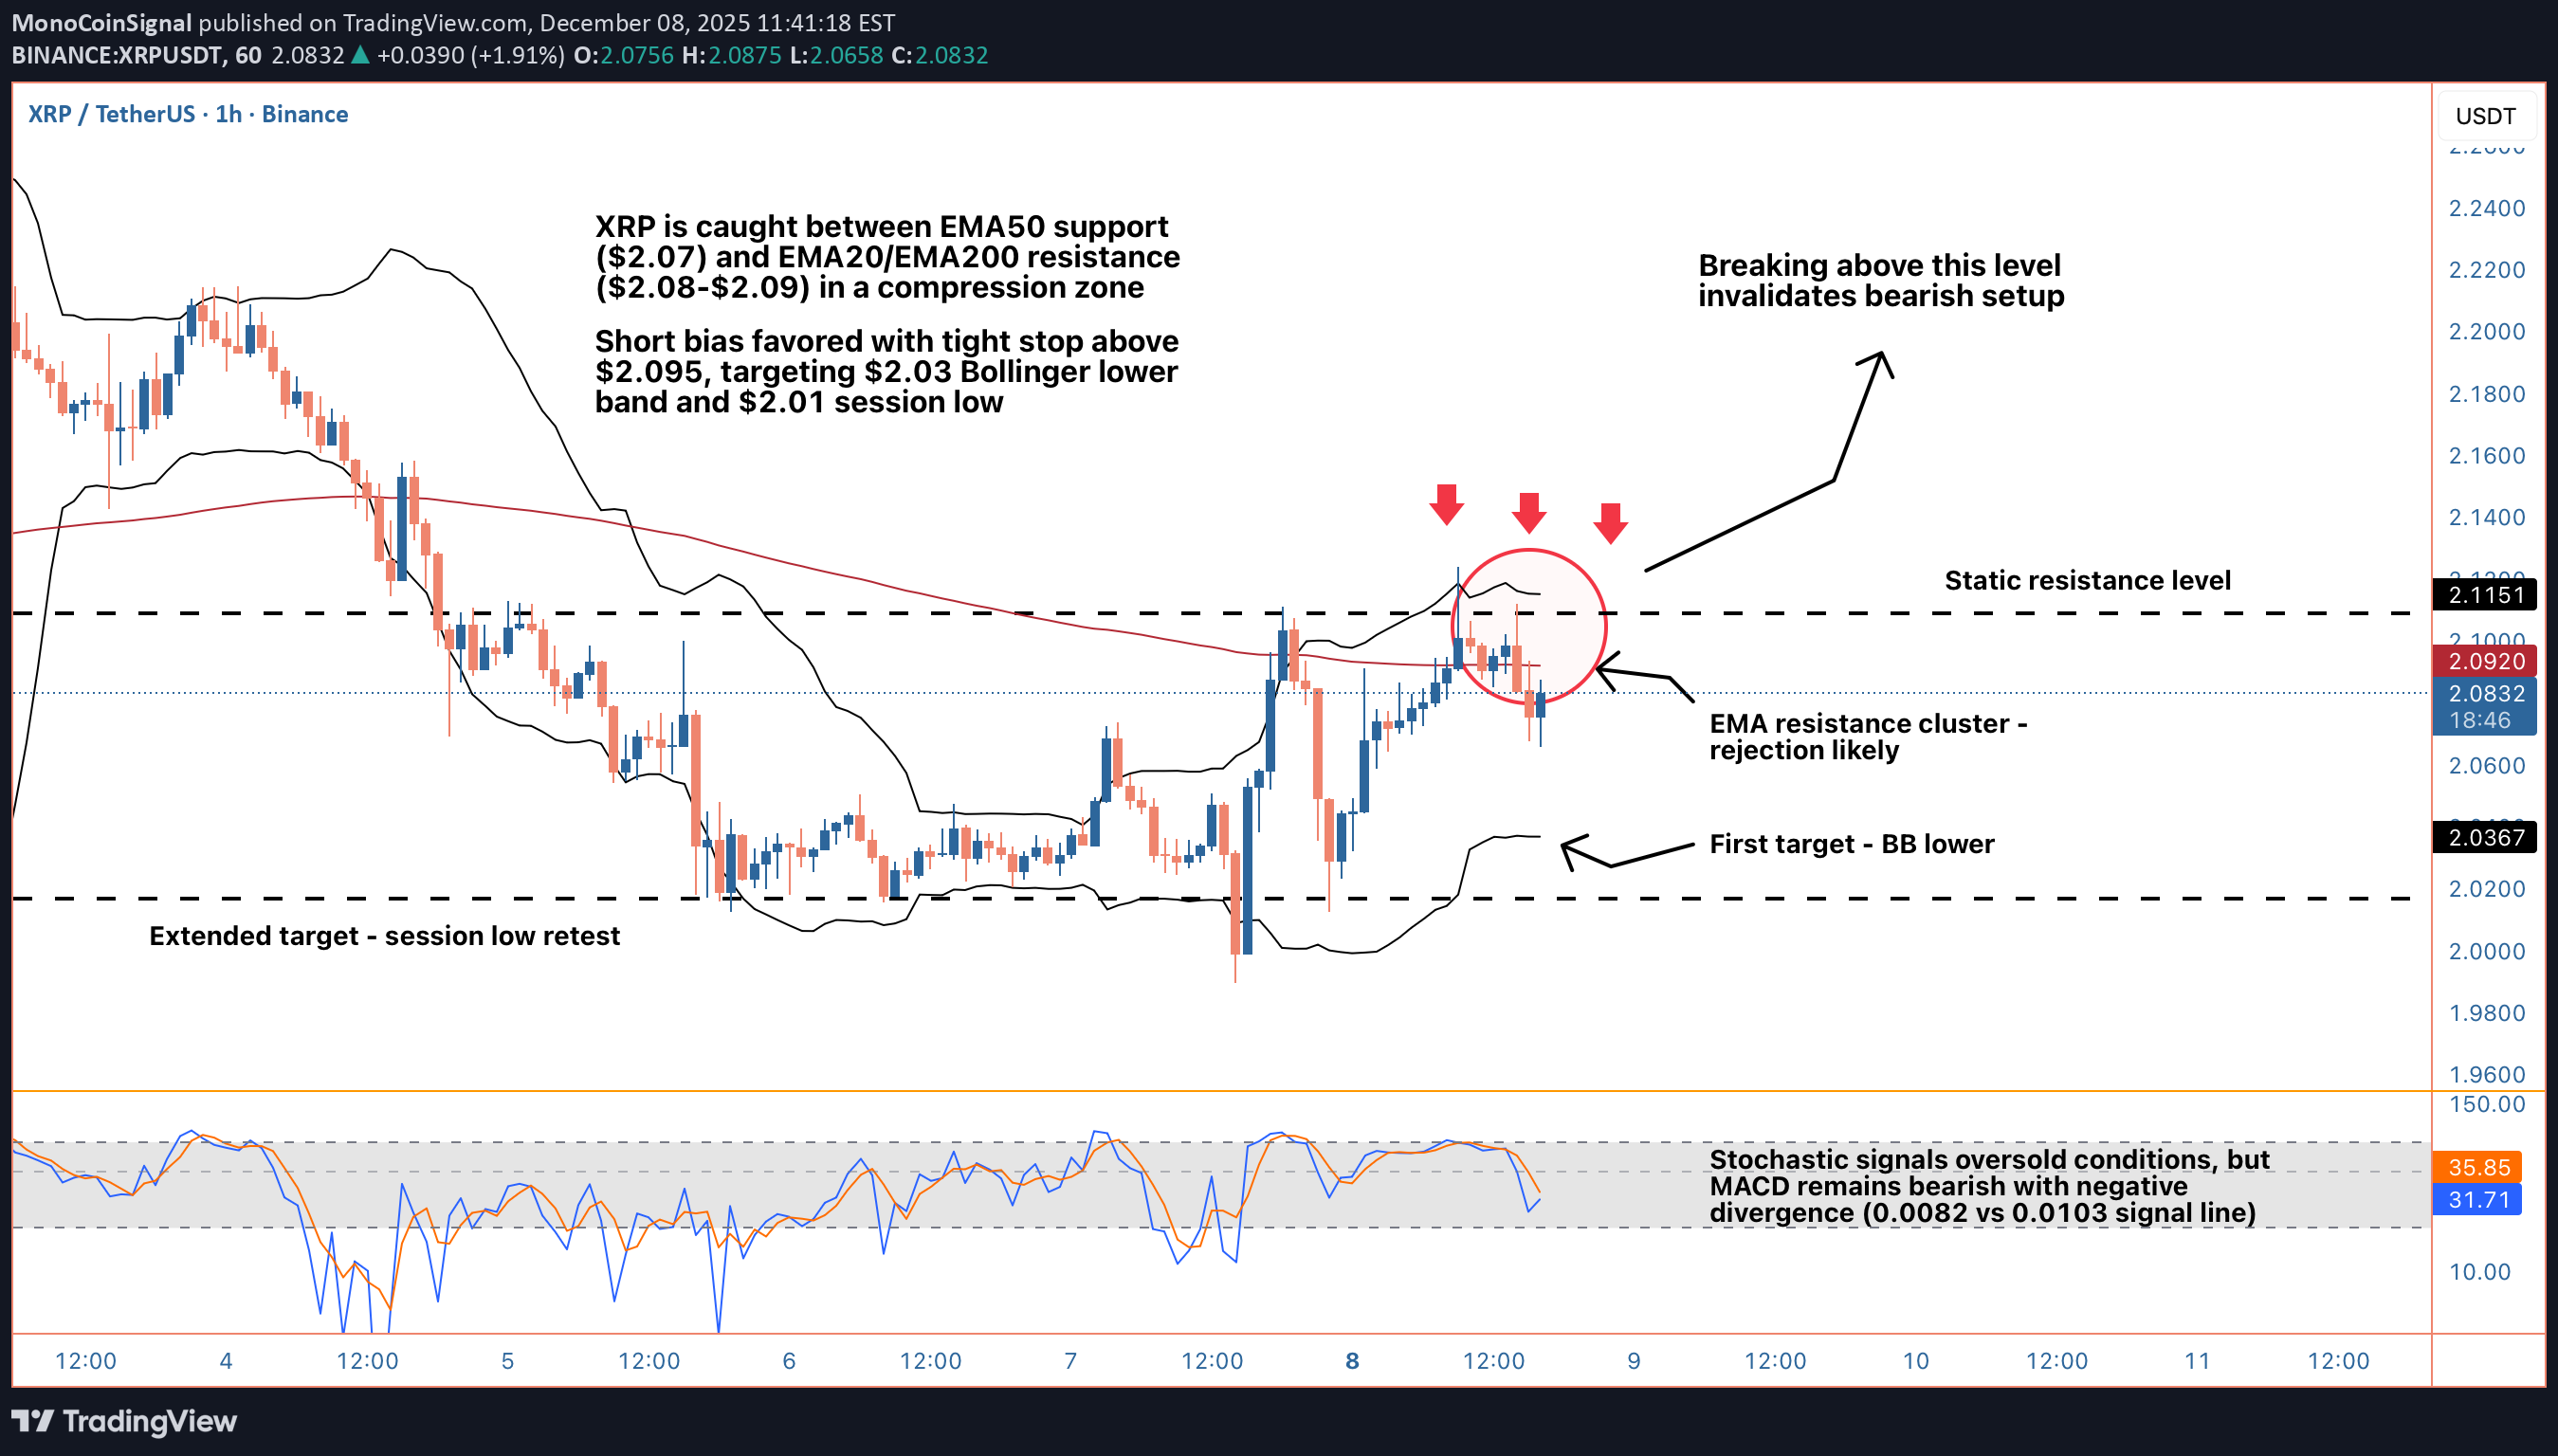
Hey guys, XRP is navigating a tight compression zone on the 1-hour timeframe, trading at $2.07 and caught between critical moving average levels that are setting up a potential directional break. Price is sitting right on the EMA50 at $2.07, which has been acting as immediate support, but overhead we've got a resistance cluster formed by the EMA20 at $2.08, EMA200 at $2.09, and HMA55 also at $2.09. That's a lot of technical density above current price, and the repeated rejections from this zone over the past several hours suggest sellers are defending it aggressively. The 24-hour range spans from $2.01 to $2.12, and we're currently positioned in the lower half, about 6 cents off the highs and 6 cents above the lows. The technical indicator suite is painting a mixed but ultimately bearish picture. Stochastic has crashed to 12.2, firmly in oversold territory, which on the surface might suggest a bounce is overdue. However, context matters here. The MACD remains in bearish configuration with the MACD line at 0.0082 sitting below the signal line at 0.0103, indicating momentum hasn't shifted despite the oversold reading. RSI at 48.5 is neutral, not providing much directional conviction, but it's worth noting we're not seeing bullish divergence that would typically accompany a reversal setup. The ADX at 33.5 confirms we're in a moderate trending environment rather than choppy consolidation, and when you combine that with the lower high formation visible in recent price structure, the trend bias leans bearish. Volume analysis is critical here and it's telling a bearish story. Current volume sits at just $10.8M, roughly 50% below the average of $21.5M. That lack of participation during this consolidation phase suggests buyers aren't showing up with conviction, even at these relatively attractive levels. When price compresses near support without volume expansion, it often precedes a breakdown rather than a reversal. The wick analysis adds another layer: lower wicks comprise 55.5% of recent candle structures, showing there have been attempts to bid price higher, but the minimal 7.3% upper wicks tell us those rallies are getting faded quickly. That's classic distribution behavior where each bounce gets sold into. Bollinger Bands provide additional context for potential targets. Price is currently trading just below the middle band at $2.07, with the upper band at $2.11 and lower band at $2.03. The bands are relatively tight, suggesting we're in a consolidation phase that's likely to resolve with a directional move soon. The MFI (Money Flow Index) at 43.0 sits below the midpoint, confirming that money flow is leaning negative but not extreme. This supports the thesis of a measured grind lower rather than a panic sell-off. From a price structure perspective, the lower high formation is the key bearish signal. After tagging $2.12 in the 24-hour session, price has failed to reclaim that level and instead printed a lower high, which is textbook bearish price action. The internal market state shows a bearish bias with a trending regime and only 26.4% directional confidence, suggesting the move might not be explosive but rather a methodical drift lower. The alignment score of 4 and the bear stack dominating (4 bearish indicators vs 1 bullish) reinforce this directional lean. For a trading setup, I'm looking at short entries on any bounce toward the $2.075-$2.08 zone, particularly if we see rejection wicks forming at the EMA20. The stop loss would sit just above the resistance cluster at $2.095, providing about 20 pips of breathing room while staying below the HMA55. A close above $2.095 would invalidate the bearish structure and suggest buyers are regaining control, so that's a logical invalidation point. First take profit target comes in at the Bollinger lower band at $2.03, offering approximately 4.5 cents of downside for roughly 2 cents of risk, which delivers better than 2:1 risk-reward. Second target would be the session low at $2.01, extending the potential reward to nearly 3.5:1 if we get full follow-through and momentum acceleration. The key level to watch is $2.07, where the EMA50 and Bollinger middle band converge. If price breaks and holds below this level with volume confirmation, I'd expect acceleration toward $2.03 as there's minimal structural support in between. Conversely, if bulls want to flip the script, they need to reclaim $2.09 with conviction and push volume above that $21.5M average to prove there's genuine buying interest rather than just short-term bounce attempts. The 24-hour change of +1.41% shows we're still in positive territory for the day, but the intraday structure has deteriorated, and the failure to hold the EMA20 is a warning sign. Risk management is crucial in this setup given the mixed signals from oversold indicators. While Stochastic at 12.2 suggests we're technically due for a bounce, trading against established bearish structure and weak volume is risky. The safer play is waiting for either a confirmed breakdown below $2.07 or a clear rejection from the $2.08-$2.09 resistance zone. If you're already short from higher levels, consider taking partial profits at $2.03 and trailing stops on the remainder toward $2.01. If you're looking to enter fresh, patience for a bounce into resistance offers better risk-reward than chasing current levels. What are you thinking on this XRP setup? Are you fading the weakness for a bounce play off EMA50 support, or riding the bearish structure down toward those lower targets?
MonoCoinSignal
بیت کوین در آستانه سقوط؟ نشانههای هشداردهنده بازار که نباید نادیده بگیرید!
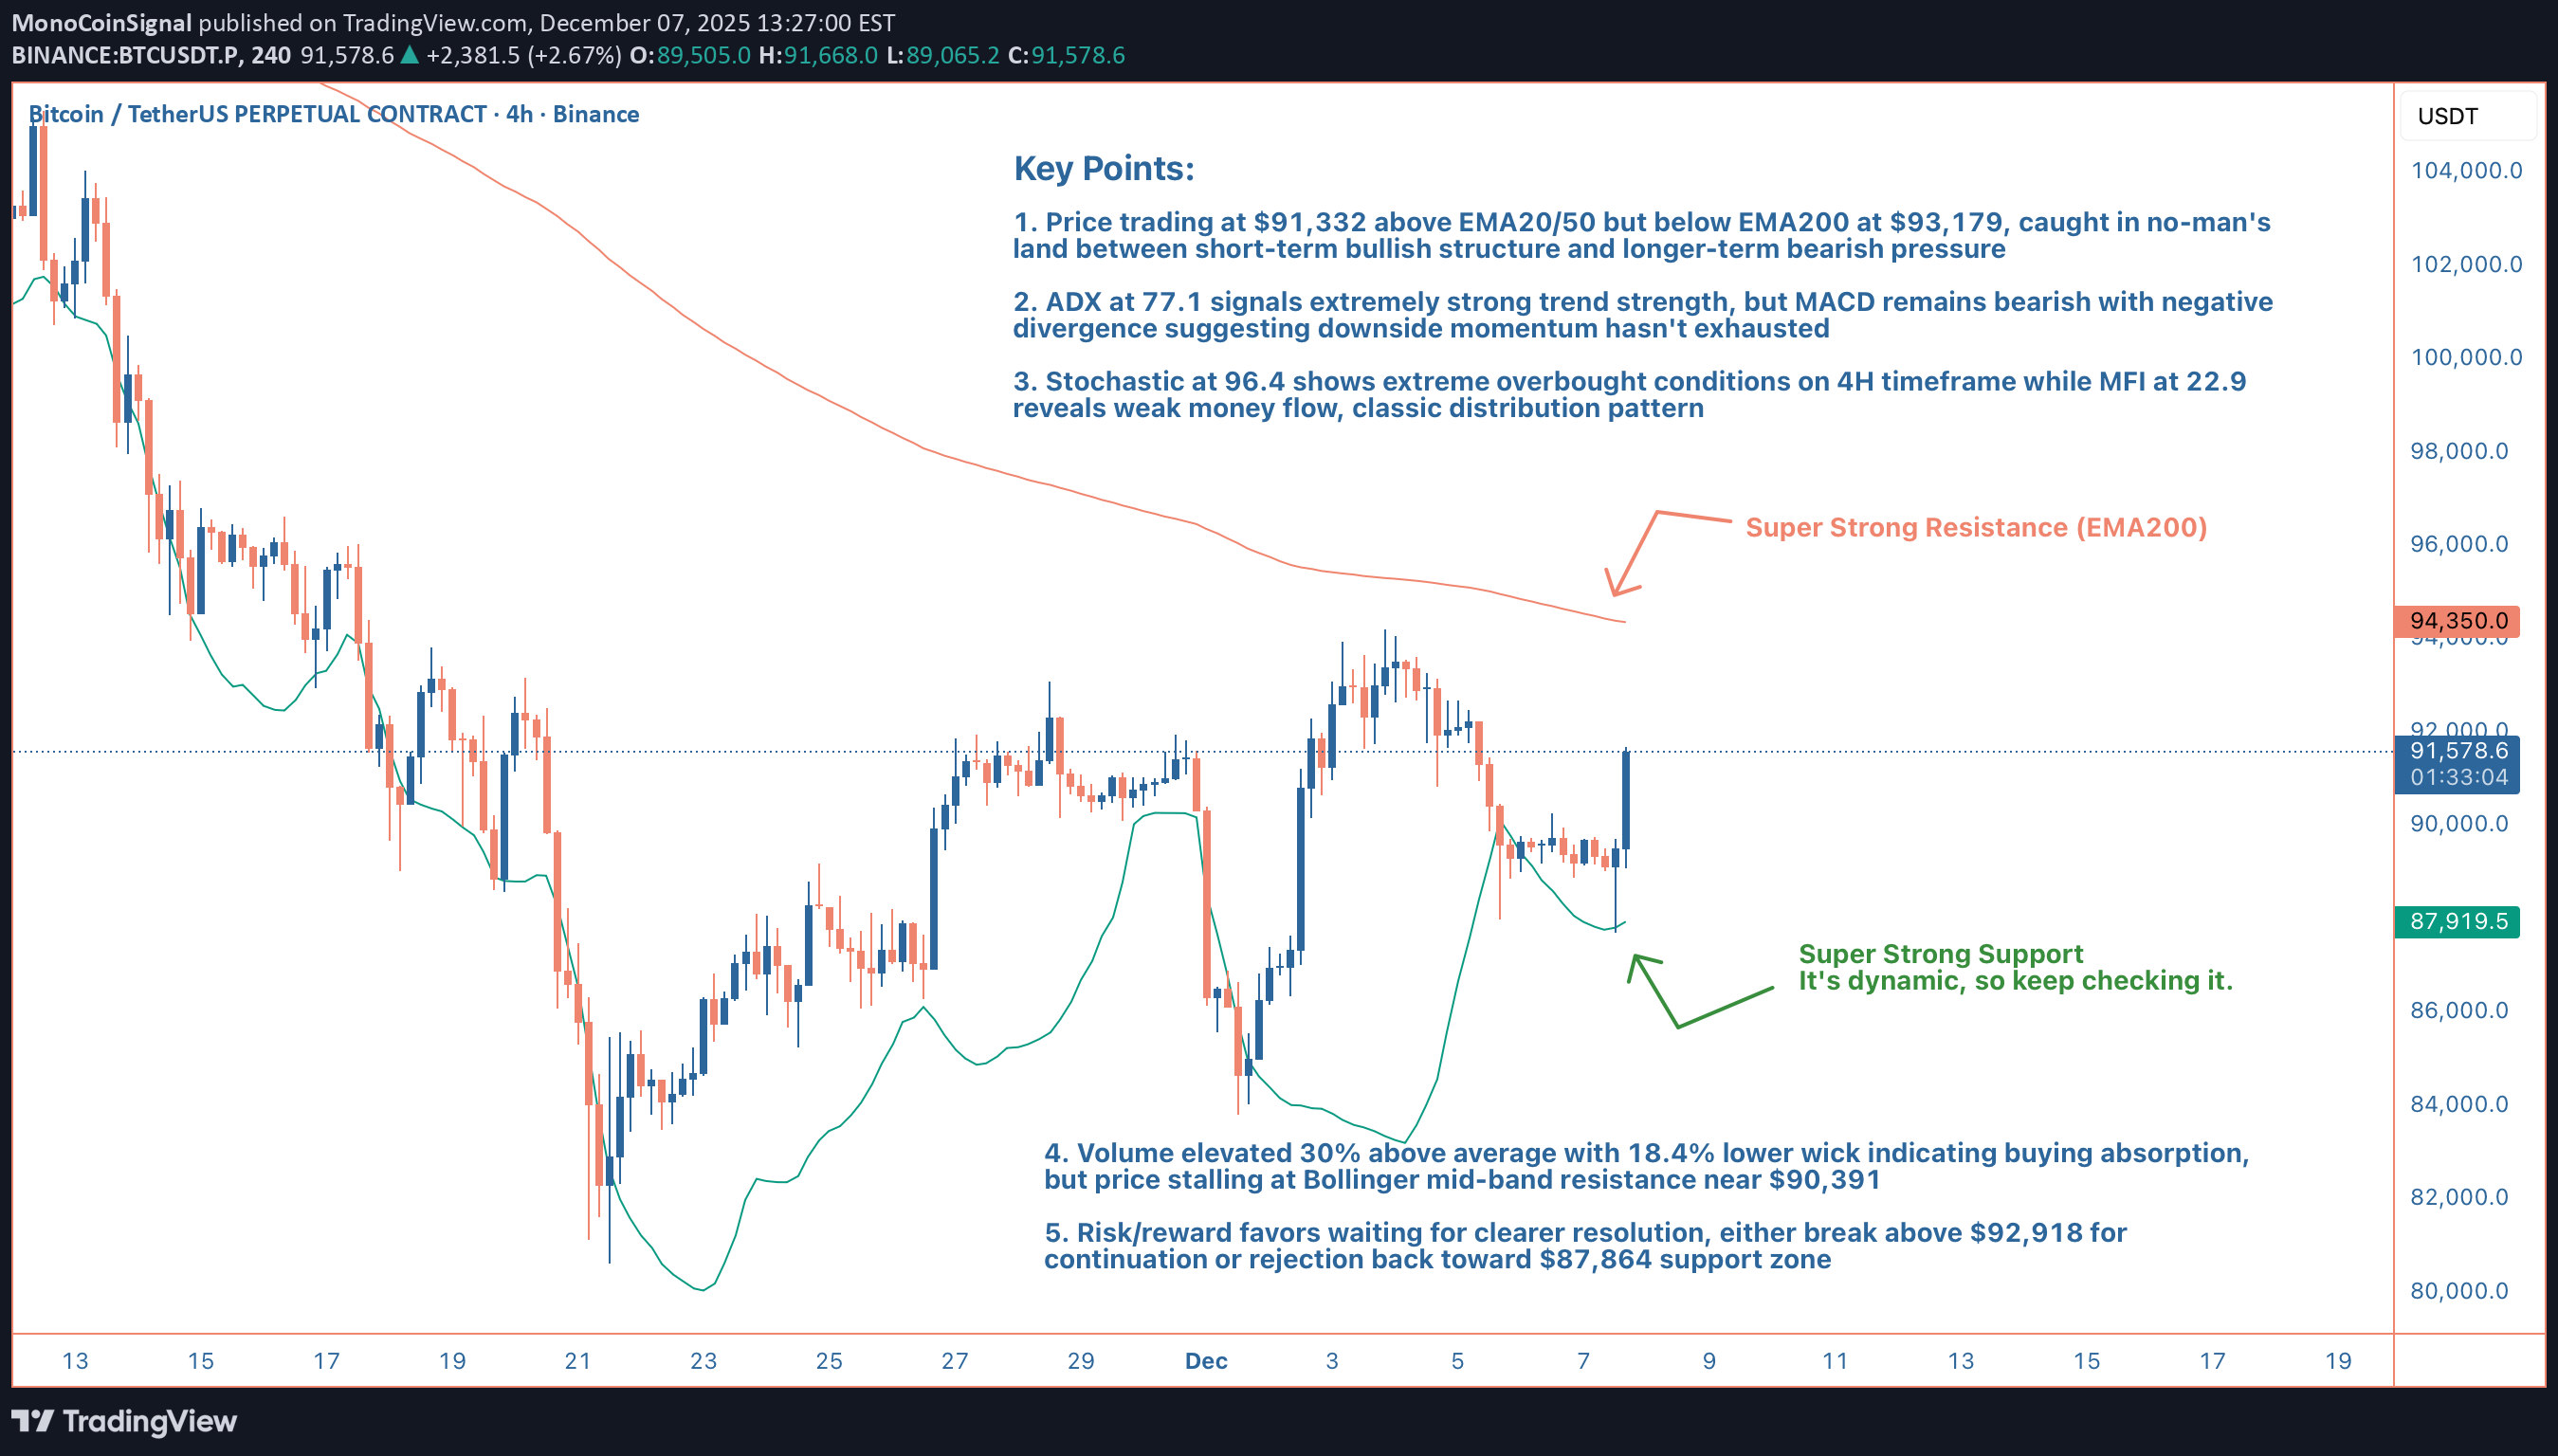
سلام بچه ها، Bitcoin در 4H در حال تنظیم چیزی است که شبیه یک الگوی توزیع کتاب درسی به نظر می رسد، و من با وجود جهش اخیر از 87688 دلار، در اینجا متمایل به نزولی هستم. قیمت در حال حاضر با قیمت 91332 دلار معامله می شود که در یک منطقه میانی واقعا ناراحت کننده قرار دارد. ما بالاتر از میانگین های متحرک کوتاه مدت هستیم (EMA20 در 90193 دلار و EMA50 در 90276 دلار) که در ظاهر صعودی به نظر می رسد. اما مشکل اینجاست: ما هنوز به شدت زیر EMA200 در 93179 دلار رد میشویم، و این سطح در حال حاضر به عنوان سقفی برای چندین جلسه عمل میکند. هر بار که به سمت 92900 تا 93200 دلار پیش می رویم، فروشندگان وارد hard می شوند. این منطقه عرضه اولیه شما است و با محدودیت بالای Bollinger Band در 92,918 دلار تقویت شده است. پشته نشانگر جایی است که چیزها واقعاً جالب می شوند. ADX روی 77.1 فریاد می زند، این قدرت روند فوق العاده ای است، مردم. اما کدام گرایش؟ MACD همچنان نزولی در 286.85- است در مقابل سیگنال 284.68-، که به ما می گوید حرکت حرکتی با وجود این جهش همچنان رو به نزول است. مهمتر از آن، Stochastic را در 96.4 بررسی کنید، که در تایم فریم 4H به میزان زیادی بیش از حد خرید شده است. هنگامی که Stochastic را گسترش یافته می بینید، معمولاً نزدیک یک قله محلی هستید، نه شروع یک رالی. اینجاست که تند می شود: MFI فقط 22.9 است. اجازه دهید آن را پایین بیاورد. قیمت در حال افزایش است، Stochastic بیش از حد خرید شده است، اما پول flow کاملاً کم خون است. این واگرایی کلاسیک است، قیمت با کاهش مشارکت افزایش می یابد. پول هوشمند در حالی که خردهفروشی آن را خریداری میکند، به قدرت تقسیم میشود. من این فیلم را قبلا دیده بودم و برای خریداران دیرهنگام پایان خوبی ندارد. تجزیه و تحلیل حجم از پایان نامه نزولی پشتیبانی می کند. ما 30 درصد بالاتر از میانگین در 26852 دلار کار می کنیم که مشارکت فعال را تایید می کند. اما به ساختار فیتیله توجه کنید: 18.4 درصد فتیله پایین نشان می دهد که خریداران به شدت وارد عمل شده اند، با این حال ما یک فتیله 5.6 درصدی داریم که نشان می دهد فروشندگان بلافاصله این فشار را جذب کرده اند. در یک روند صعودی سالم، شما می فتیله های بالایی کوچک و بسته های قوی را ببینید. این سازه شمعی فریاد می زند. از منظر ساختاری، ما یک پایین ( صعودی ) بالاتر را تشکیل داده ایم، اما هنوز یک اوج بالاتر (خنثی تا نزولی) را تایید نکرده ایم. این باعث می شود که این یک پرچم بالقوه خرس باشد تا یک الگوی معکوس. باندهای بولینگر داستان مشابهی را تعریف میکنند، ما دقیقاً بالای وسط band با 90,391 دلار معامله میکنیم، اما نتوانستهایم حرکتی را به سمت بالاترین band حفظ کنیم. آن وسط band اکنون بهعنوان مقاومت عمل میکند تا حمایت، که یک تلنگر نزولی است. سطوح پشتیبانی برای تماشا: پشتیبانی فوری در HMA55 حدود 90,540 دلار و سپس EMA20 در 90,193 دلار قرار دارد. اگر آن ها شکست بخورند، ما به دنبال بازگشت سریع move به پایین ترین بولینگر Band در 87,864 دلار هستیم که با پایین ترین قیمت امروز 87,688 دلار مطابقت دارد. این منطقه قبلاً شاهد علاقه خرید قابل توجهی بود، بنابراین باید جهش ایجاد کند، اما اگر شکست بخورد، میتوانیم شاهد شتاب به سمت محدوده 86200-85500 دلار باشیم که در آن خوشههای پشتیبانی هفتگی وجود دارد. مقاومت به وضوح تعریف شده است: 92,918 دلار (بالینگر بالا)، 93,179 دلار (EMA200) و 93,500 دلار (روانی). هرگونه تداوم move بالای 93200 دلار این تنظیم نزولی را باطل می کند و نشان می دهد که ما برای کشف قیمت به سمت منطقه 95000 دلار حرکت می کنیم. اما با سرعت و خوانش اندیکاتور فعلی، من کمتر از 30 درصد احتمال را به آن سناریو اختصاص می دهم. تنظیم معاملات: من به ورودی های کوتاه در محدوده 89,800 تا 90,500 دلار نگاه می کنم، اگر در نمودار 1H شکل گیری بالاتری کمتر داشته باشیم. استاپ ضرر به بالای 92500 دلار می رسد تا جایی برای شکست کاذب فراهم شود. اهداف 87800 دلار (TP1)، 86200 دلار (TP2) و 85000 دلار (TP3) برای معامله گران تهاجمی است. ریسک/پاداش در این مورد تقریباً 1:2.5 نسبت به هدف اول است که با توجه به تلاقی سیگنالهای نزولی قابل قبول است. وضعیت بازار داخلی سوگیری صعودی را نشان میدهد، اما فقط 38.6% اطمینان جهتدار دارد، که اساساً یک سکه است، و وقتی الگوها تا این حد نامطمئن هستند، move اخیر را محو میکنم. پشته خرس گاو نر 6-2 صعودی به نظر می رسد تا زمانی که متوجه شوید که این تنها 75% توافق است، و با ADX این بالاتر، برای ادامه به تایید تقریباً متفق القول نیاز داریم. خط پایانی: به نظر می رسد که این یک جهش اصلاحی در یک روند نزولی بزرگتر است تا شروع یک حرکت صعودی جدید. ترکیبی از Stochastic بیش از حد خرید، جریان پول ضعیف، MACD نزولی و سربار خوشه مقاومت، احتمالات را به سمت وضوح نزولی متمایل می کند. من به این 68% اطمینان نزولی میدهم، نه قلمرو slam-dunk، بلکه به اندازه کافی مزیت برای گرفتن موقعیت با مدیریت ریسک مناسب دارد. بچه ها اینجا چی می بینید؟ آیا این جهش را محو میکنید یا منتظر تأیید بالای 93200 دلار هستید؟Bitcoin به مقاومت رسید و رد شد. اما اکنون صدا به اندازه کافی برای شکست دوباره بالا نیست. فعلا در حال تحکیم چرا را اینجا ببینید:
سلب مسئولیت
هر محتوا و مطالب مندرج در سایت و کانالهای رسمی ارتباطی سهمتو، جمعبندی نظرات و تحلیلهای شخصی و غیر تعهد آور بوده و هیچگونه توصیهای مبنی بر خرید، فروش، ورود و یا خروج از بازارهای مالی نمی باشد. همچنین کلیه اخبار و تحلیلهای مندرج در سایت و کانالها، صرفا بازنشر اطلاعات از منابع رسمی و غیر رسمی داخلی و خارجی است و بدیهی است استفاده کنندگان محتوای مذکور، مسئول پیگیری و حصول اطمینان از اصالت و درستی مطالب هستند. از این رو ضمن سلب مسئولیت اعلام میدارد مسئولیت هرنوع تصمیم گیری و اقدام و سود و زیان احتمالی در بازار سرمایه و ارز دیجیتال، با شخص معامله گر است.