تحلیل تکنیکال MonoCoinSignal درباره نماد PAXG در تاریخ ۱۴۰۴/۹/۲۲

MonoCoinSignal
Choppy Waters Ahead
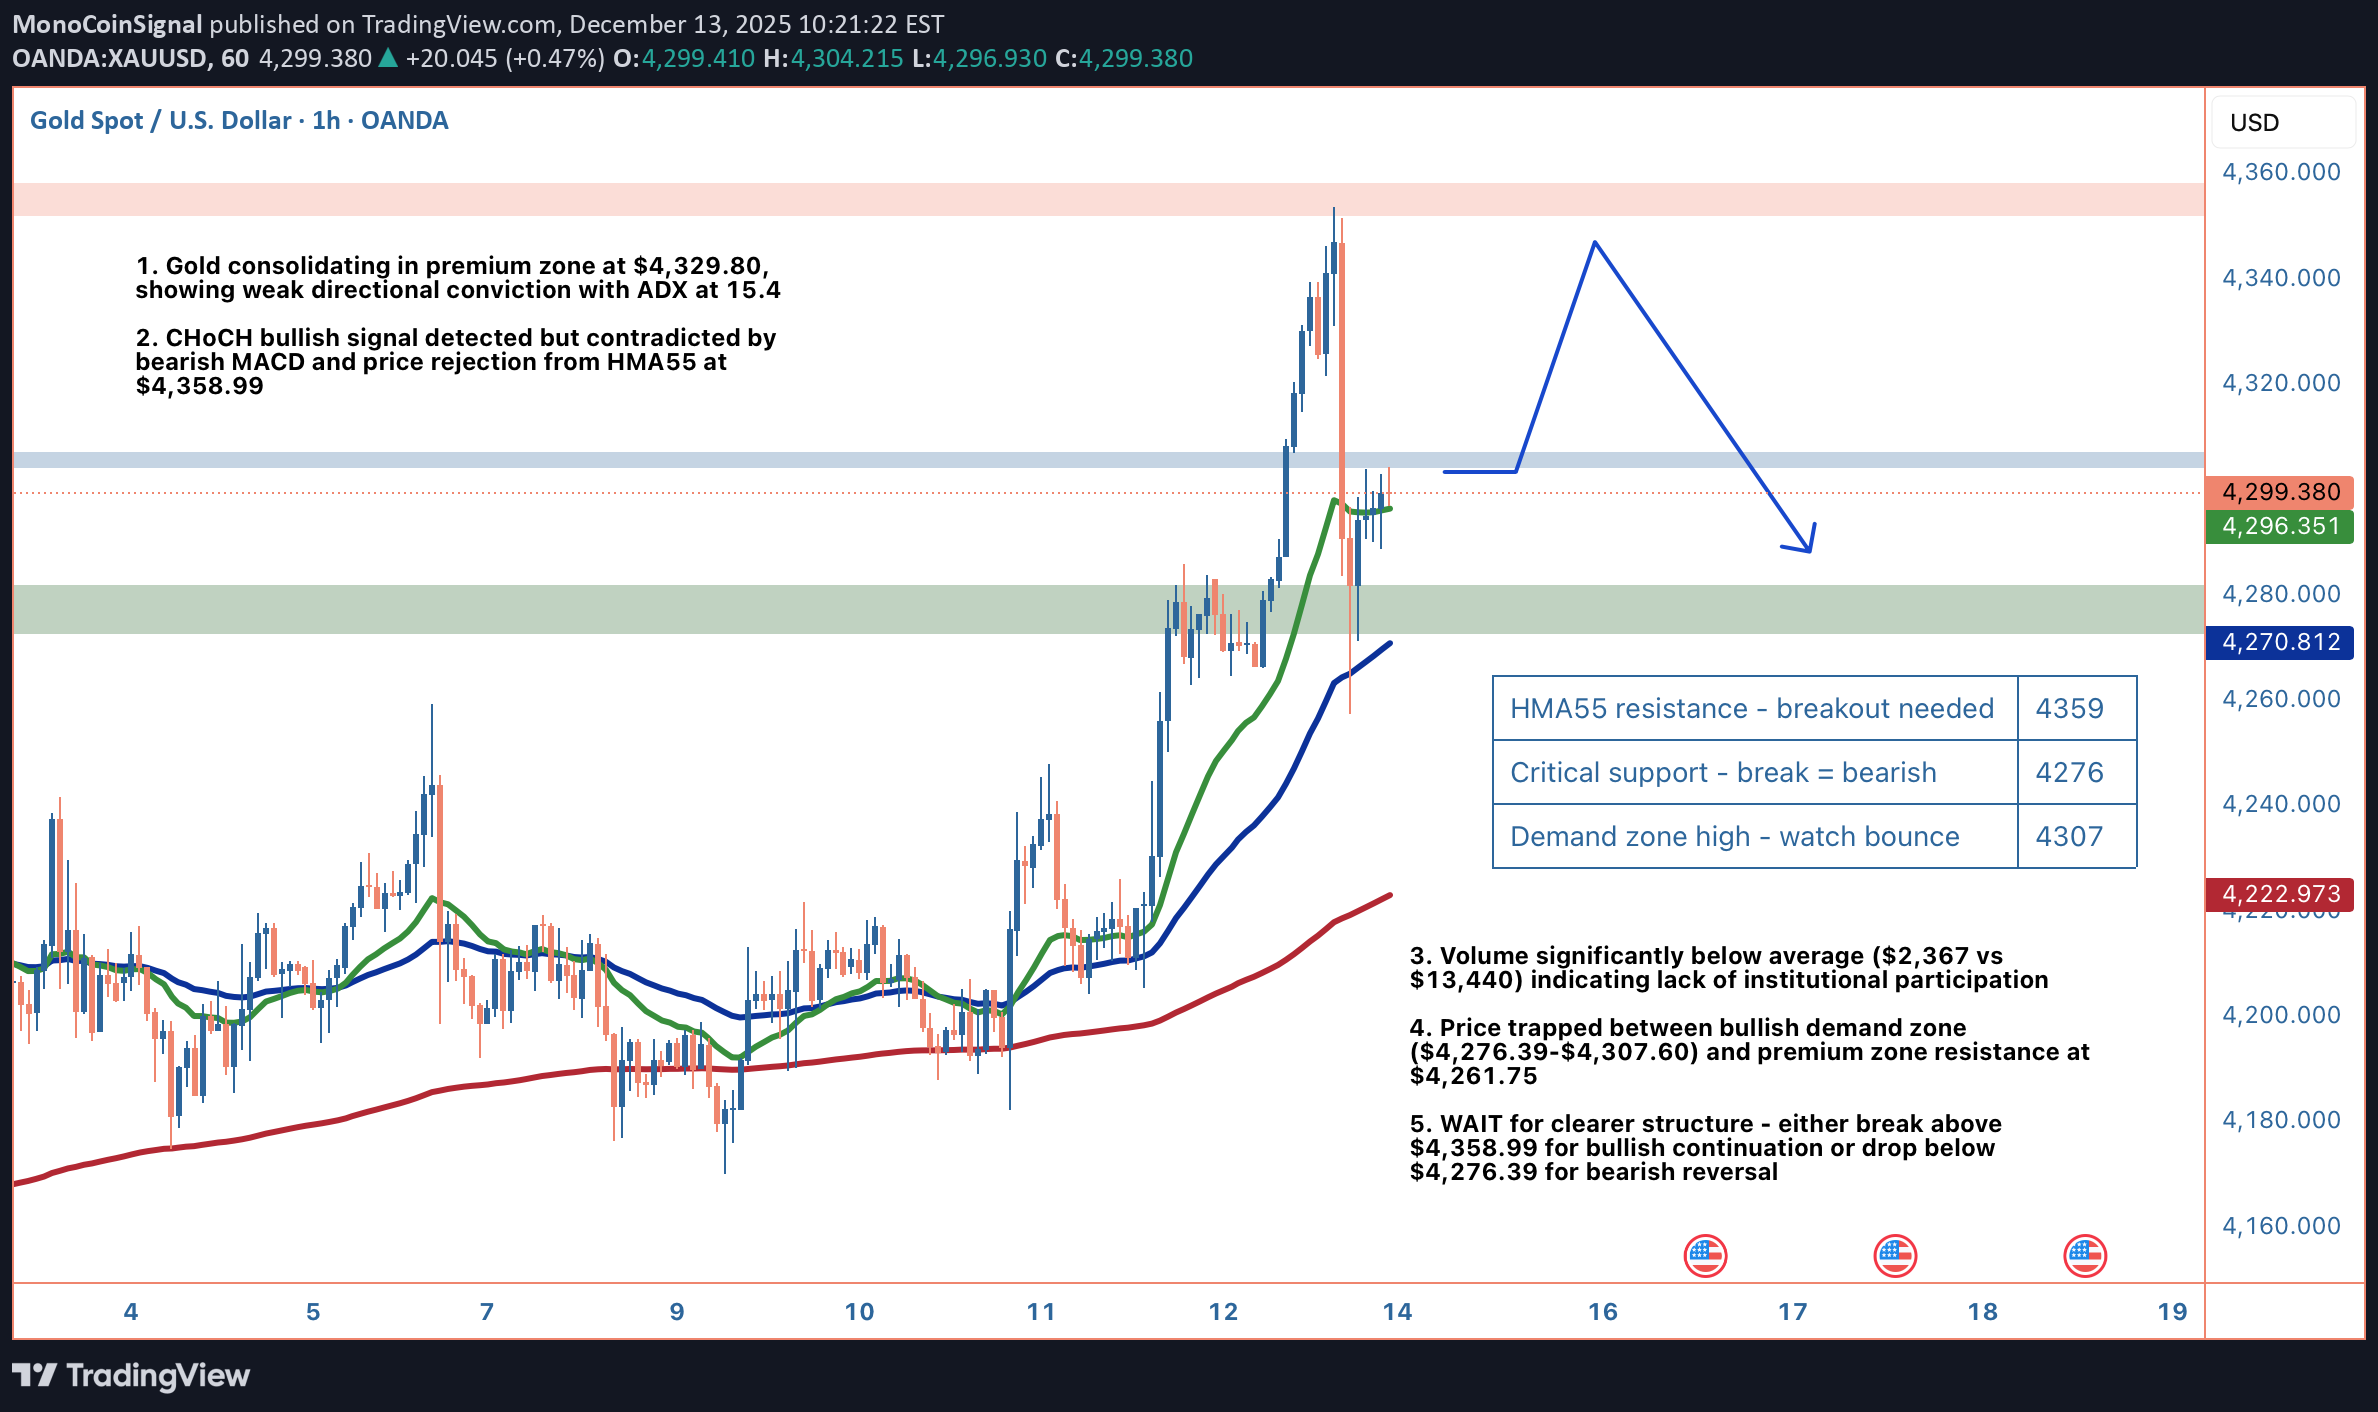
Hey traders, hope your charts are treating you better than this choppy gold action! Gold is serving up a classic case of market indecision at $4,329.80, and honestly, this is one of those moments where patience beats forcing a trade. We're sitting in premium territory, which typically favors sellers, but the price action is so lackluster that neither bulls nor bears have control. The ADX at 15.4 confirms what your eyes are probably telling you: this trend has zero strength right now. Let's break down what's actually happening here. Price is hovering just above the EMA20 at $4,328.00 and well above the EMA50 at $4,301.44, which would normally signal bullish momentum. But here's the kicker: we're still below the EMA200 at $4,329.79, creating this awkward middle ground where neither side can claim victory. The RSI at 53.5 is perfectly neutral, and the Stochastic at 54.6 mirrors that same indecision. Even the MACD is showing bearish divergence with the histogram trending down, yet it's not strong enough to trigger real selling pressure. The volume situation is what really concerns me. Current volume sits at $2,367 compared to an average of $13,440. That's an 82% drop, folks. When institutional money isn't participating, any moves we see are likely retail-driven and prone to quick reversals. This explains why we've been range-bound between $4,302.70 and $4,335.00 for the past 24 hours with virtually no net change. From a Smart Money Concepts lens, we've got some interesting dynamics at play. There's a bullish order block (demand zone) sitting between $4,276.39 and $4,307.60 that's been respected so far. This represents an area where smart money previously accumulated positions, and it's acting as a floor. Above us, the HMA55 at $4,358.99 is providing dynamic resistance, and price got rejected from this level recently. The bearish fair value gap from $4,326.50 to $4,339.29 has already been filled, so that imbalance is off the table. The market structure shows a CHoCH bullish signal, suggesting a potential trend reversal to the upside. However, I'm skeptical of this signal given the weak volume and conflicting indicators. For this bullish reversal to have legs, we'd need to see a decisive break above $4,358.99 with a surge in volume. That would open the door to the Bollinger upper band at $4,385.62 and potentially the recent swing high at $4,387.79. On the flip side, if we lose the bullish order block at $4,276.39, that's your signal that the bears are taking control. A breakdown there would target the equilibrium level at $4,233.00, which represents fair value in the current range. Below that, we're looking at the discount zone and potentially the swing low at $4,183.60, though that's a significant move that would require sustained selling pressure. The Bollinger Bands tell an interesting story too. We're trading below the middle band at $4,333.22, which adds to the neutral-to-slightly-bearish bias. The bands aren't particularly wide, suggesting low volatility, which aligns with our weak ADX reading. In these conditions, mean reversion trades often work better than trend-following strategies. Here's my trading plan for this setup. I'm not taking any immediate positions because the risk/reward simply isn't there. If you're itching to trade, wait for one of two scenarios. Scenario one: a break and 4-hour close above $4,358.99 with volume at least 50% above average. That would be your long entry signal, targeting $4,385.62 first, then $4,387.79. Your stop would go below $4,330.00, giving you about a 1:2 risk/reward ratio. Scenario two: a breakdown below $4,276.39 on a 4-hour close. That's your short entry, targeting $4,233.00 initially, with an extended target at $4,183.60 if momentum continues. Your stop would sit above $4,307.60, the top of the order block. This gives you a much better risk/reward of around 1:3 to the first target. The key invalidation level for any bullish thesis is $4,275.00. A close below that breaks the demand zone structure and confirms bearish control. For bears, a reclaim of $4,358.99 would invalidate the short setup and suggest the bulls are regaining strength. One more thing to watch: the wick analysis shows 83.9% lower wick versus 16.1% upper wick on the recent candle. This suggests buyers are stepping in at lower prices, but they're not strong enough to push price higher. It's defensive buying, not aggressive accumulation. That's another reason to wait for clearer signals. Bottom line: this is a WAIT situation. The market is in consolidation mode with weak trend strength, conflicting signals, and terrible volume. Forcing trades in these conditions is how accounts get chopped up. Let the market show its hand first. Either we get a clean breakout above $4,358.99 or a breakdown below $4,276.39. Until then, preserve your capital and wait for a high-probability setup. What's your take on gold right now - are you seeing something I'm missing, or are you also sitting on your hands waiting for clarity?