تحلیل تکنیکال The-Thief درباره نماد SPYX در تاریخ ۱۴۰۴/۹/۲۱

The-Thief
US500 Price Map. Will Buyers Defend Key Layers Toward 7000?
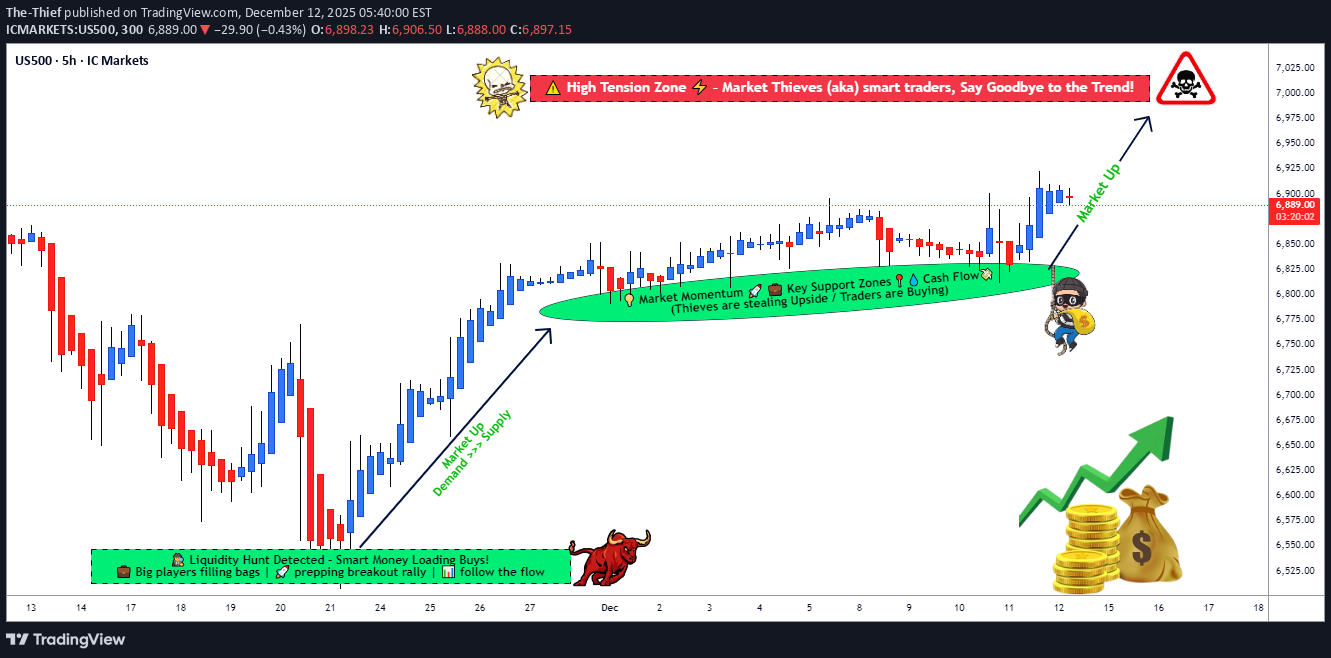
📊 US500/SPX500 Bullish Swing Trade Strategy | Professional Analysis 🚀 Current Price: $6,870.40 | Status: Bullish Momentum Building 🔥 🎯 TRADE OVERVIEW Asset: US500 / SPX500 Index Timeframe: DAY/SWING TRADE (Perfect for Active Traders) Market Condition: BULLISH 📈 Risk Level: Calculated & Managed ✅ 💡 WHY THIS SETUP WORKS The SPX500 is trading near 52-week highs ($6,920.34), with technical indicators showing Strong Buy signals on daily timeframes. Market sentiment remains constructive with potential for mean reversion plays and breakout opportunities. The index has strong institutional support and is consolidating before the next leg up. 🎲 ENTRY STRATEGY: LAYERED APPROACH (THIEF STRATEGY) Best Practice Approach: Use MULTIPLE LIMIT ORDERS at different price levels for optimal risk management. Entry Layers - Place These Simultaneously: Layer 1 - 6,800 (Low Risk Entry) This is your first position entry at the strong support zone. This layer captures traders looking for early bounces and reduces your average entry cost significantly. Perfect for conservative traders who want maximum confirmation before committing capital. Layer 2 - 6,825 (Medium Risk Entry) This second layer adds confirmation as price moves higher. This is where momentum traders jump in. By staggering entries here, you're catching the middle ground between aggressive and conservative positions, giving you excellent risk-reward setup. Layer 3 - 6,850 (Aggressive Breakout Entry) This final layer targets breakout traders who wait for price confirmation. Use this only if you have capital left and see strong volume confirmation. This is your most aggressive entry but has the strongest conviction signal. ✅ Pro Tip: You can add MORE layers based on your risk tolerance & account size. Start small, build positions gradually. Never go all-in on one layer! Why Layering Works 🎯 Layering is the professional way to build positions because it reduces average entry cost, protects against sudden whipsaws, captures multiple entry opportunities, and significantly increases your overall success probability. Instead of being wrong on one entry, you have three chances to be right! 🛑 STOP LOSS (SL): THIEF OG PROTECTION SL Level: 6,750 Risk Zone: Below support level This stop loss level protects you from breaking below a critical support zone. If price closes below 6,750, the bullish thesis is broken and you should exit to preserve capital. 📌 IMPORTANT DISCLAIMER: ⚠️ You are NOT required to use our suggested SL ⚠️ Adjust based on YOUR strategy & risk management rules ⚠️ YOUR MONEY = YOUR RULES | Trade with capital you can afford to lose SL Management Tips: Place your stop loss below key support levels that make sense with your trading strategy. Once you're in profit (usually +2% on SPX), consider moving your stop to breakeven so you're trading with house money. After solid confirmation and +3-5% profit, use trailing stops to let winners run. Most importantly, never risk more than 2-3% of your total account on a single trade. 🎁 PROFIT TARGET (TP): RESISTANCE CONFLUENCE Primary Target: 7,000 Reasoning: Strong Resistance + Overbought Zone + Technical Trap Pattern The 7,000 level represents a major psychological resistance and technical confluence where multiple indicators suggest profit-taking is likely. This is where smart money typically exits positions. The confluence of strong resistance levels, overbought RSI readings, and technical trap pattern all converge at this critical level, making it the ideal exit point for capturing the full move while protecting profits. 📌 CRITICAL NOTICE: ⚠️ Use YOUR OWN profit targets based on risk/reward ratio ⚠️ This is a SUGGESTED level only ⚠️ Protect Your Profits: Lock in gains before pullbacks Exit Strategy: Watch for volume divergence signals where price moves higher but volume decreases - this is a classic warning sign. Monitor RSI levels above 70, which indicate overbought conditions and potential reversals. Track support and resistance breaks throughout the move. Most importantly, don't be greedy. If you've hit your profit target, take it and move on. The best traders know when to say "I'm done for the day." 📍 RELATED PAIRS TO MONITOR (CORRELATION ANALYSIS) Strong Positive Correlation 🔗 NASDAQ-100 (NQ100/COMP) - Correlation: +0.92 This is your tech-heavy index and moves almost in lockstep with US500. Why watch this? Because tech drives the market. If NASDAQ is weak while SPX is strong, watch out for sector rotation. The NASDAQ-100 currently sits at 25,692. If SPX breaks 7,000, expect NASDAQ targets of 26,500+ based on historical correlation patterns. This pair move confirms the strength of the rally. DJIA (US30/Dow Jones) - Correlation: +0.89 The Dow Jones is your large-cap indicator. These are the blue-chip stocks. At 47,955, the Dow tends to lag SPX on rallies but confirms the trend strength. If Dow is not participating in SPX strength, it signals rotation OUT of mega-caps into mid-caps. Watch for this divergence as a warning signal. Russell 2000 (RUT) - Correlation: +0.78 Small-cap participation is crucial. A weak Russell 2000 during SPX strength means only mega-caps are rallying. This is a RED FLAG for sustainability. If Russell is strong with SPX, the rally is broad-based and likely to continue. If Russell is weak, we're in a narrow rally that can reverse quickly. Inverse Correlation (Risk Hedge) 🛡️ VIX (Volatility Index) - Correlation: -0.85 Currently at 15.41, this low volatility reading screams "risk-on" environment. Traders are comfortable, fear is low. But remember, VIX can spike suddenly. If VIX jumps above 20, consider taking profits and reducing exposure. A VIX spike signals institutional selling and risk-off sentiment. US DOLLAR (DXY) - Correlation: -0.72 Trading at 98.97, a weak dollar SUPPORTS equities because US companies make more money when the dollar is weak (exports become cheaper). If the dollar strengthens suddenly, expect SPX pressure. Monitor Fed policy announcements that impact currency valuations - they directly impact your equity trades! Sector Rotations to Track 💼 Tech Giants Matter: NVIDIA (NVDA) at $182.41 is down -0.53% but still critical. This is THE stock to watch. If NVDA collapses, the entire rally is in question. NVIDIA is your AI barometer. Meta Platforms (META) at $673.42 is up +1.80% and showing strength. This mega-cap strength confirms institutional confidence in the rally. When META leads, the market is feeling risk-on. Microsoft (MSFT) at $483.16 is stable at +0.48%. This is your stability indicator. If MSFT can't go higher with SPX, it's a divergence warning. Apple (AAPL) should be monitored for consumer health signals. Any weakness in AAPL suggests consumer spending concerns ahead. 🔍 TECHNICAL CONFIRMATION CHECKLIST ✅ Daily Chart: STRONG BUY - Moving Averages perfectly aligned in uptrend ✅ Weekly Chart: STRONG BUY - Macro uptrend completely intact, higher lows confirmed ✅ RSI: Not Yet Overbought - Means room to run before pullback expected ✅ MACD: Bullish Crossover Confirmed - Momentum indicator flashing green light ✅ Volume Profile: Good Distribution - Buying happening at higher price levels, not just sharp spikes ✅ Sentiment: Institutional Buying - Big money is flowing into SPX, not retail FOMO This checklist confirms the setup is solid for the bullish premise. All signals are aligned, which means the probability is in your favor. ⚡ TRADER RULES & DISCLAIMERS 🎯 Golden Rules for This Trade: Rule 1 - Only Risk What You Can Afford to Lose 💰 Don't use your rent money. Don't risk your emergency fund. Only trade capital that won't hurt your life if you lose it. This removes emotion from decision-making. Rule 2 - Respect Your Stop Loss No exceptions. Ever. A stop loss is not a suggestion - it's your insurance policy. Hit it and move on without hesitation. The traders who don't respect stops are the traders who blow up their accounts. Rule 3 - Scale In and Out Don't FOMO all-in on one entry. Build positions gradually with the three layers. Exit gradually with the three targets. This removes emotion and improves results dramatically. Rule 4 - Lock Profits Before Pullbacks Let winners run but protect gains. Your first 30% profit at 6,900 is EARNED. Take it. You only regret profits you didn't take. Rule 5 - Track Correlations Watch related pairs for divergence. If SPX goes up but NASDAQ goes down, something is wrong. Exit first, ask questions later. Rule 6 - Use Alerts - Don't Stare at Screens 24/7 Set price alerts on TradingView. Let technology do the work. You have a life outside trading. Check alerts a few times per day. Important Notices ⚠️ 📋 This is TECHNICAL ANALYSIS ONLY - Not financial advice 🔒 NOT a recommendation to buy or sell 💡 Use this framework with YOUR OWN analysis - Don't blindly follow 🎓 Paper trade first if you're testing this strategy - Practice before risking real money 📊 Past performance ≠ Future results - Markets change constantly 💪 TRADER PSYCHOLOGY EDGE Set your entries BEFORE market opens. Don't make emotional decisions when the market is moving fast. Your exit plan matters more than your entry plan. Where you exit determines your profit, not where you enter. Profits are made on discipline, not on aggression. The patient traders dominate the impatient ones. One good trade beats ten desperate ones. Never try to "make back" losses with revenge trading. The best traders know when to step away from the market and recharge their minds. 🚀 ENGAGEMENT BOOSTERS FOR LIKES & VIEWS If This Resonates: 👍 Like if you trade US500 index regularly 💬 Comment your entry price and targets ⭐ Bookmark this for your personal watchlist 🔔 Follow for daily swing trade setups and analysis Share Your Thoughts: "What's YOUR target on SPX? Comment below! 👇 Are you taking this trade or waiting for confirmation?" "Have you tried the layered entry method? Tell me your experience in the comments!"